Top 30
Years to avoid.
Models where the year you buy makes the biggest difference to first-time MOT pass rate. Ranked by the gap between the worst and best band — the bigger the gap, the more the registration year matters.
DVSA 2024 test data. Minimum 100 tests per band. Bands: pre-2018 / 2018–2020 / 2021+.
- 01
Citroen C3
Avoid: Pre-2018 (68.3%) Buy: 2021+ (92.7%) 327,210 tests+24.4 pts spread - 02
Toyota Corolla
Avoid: Pre-2018 (67.1%) Buy: 2021+ (91.2%) 132,147 tests+24.1 pts spread - 03

Citroen C5
Avoid: Pre-2018 (66.9%) Buy: 2021+ (90.6%) 40,381 tests+23.7 pts spread - 04
Renault Clio
Avoid: Pre-2018 (66.1%) Buy: 2021+ (89.6%) 596,897 tests+23.5 pts spread - 05
Nissan Micra
Avoid: Pre-2018 (68.9%) Buy: 2021+ (91.8%) 430,570 tests+22.8 pts spread - 06
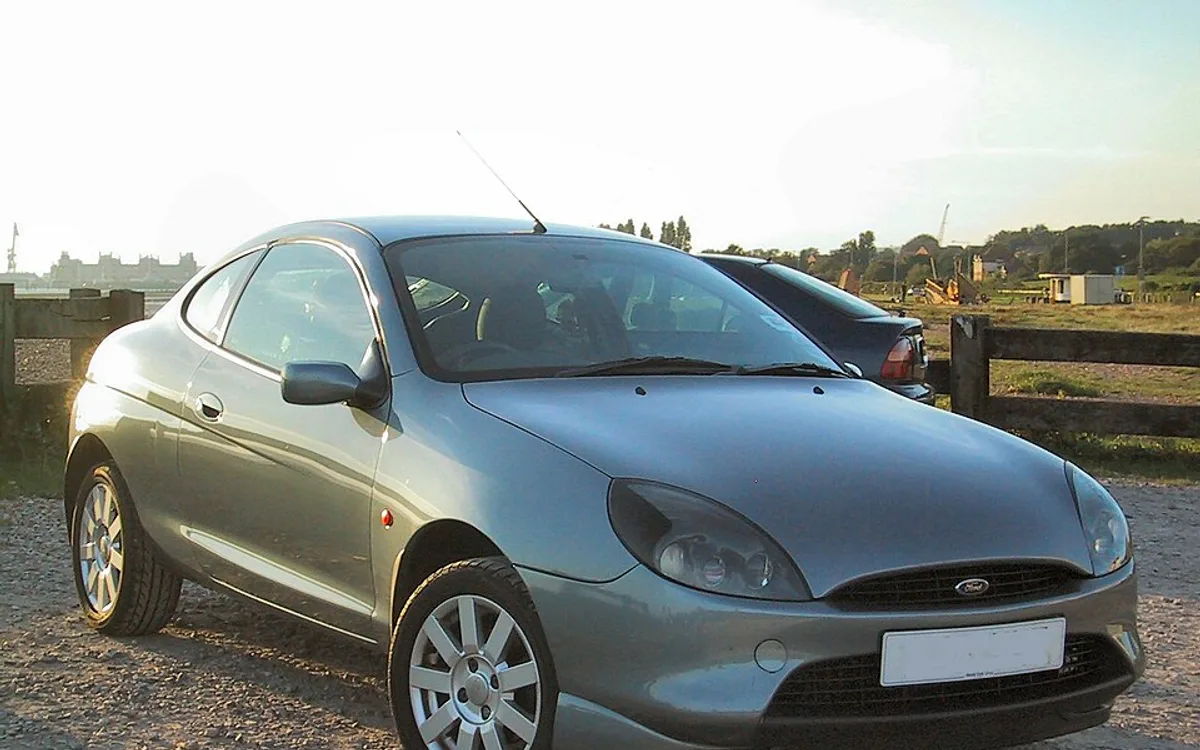
Ford Puma
Avoid: Pre-2018 (67.0%) Buy: 2021+ (89.7%) 5,377 tests+22.7 pts spread - 07
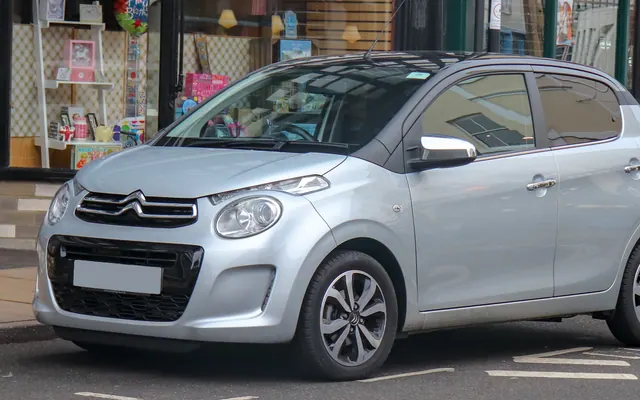
Citroen C1
Avoid: Pre-2018 (73.2%) Buy: 2021+ (95.7%) 276,634 tests+22.6 pts spread - 08
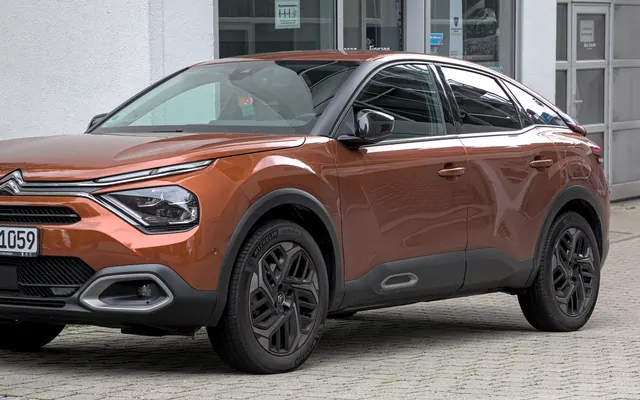
Citroen C4
Avoid: Pre-2018 (67.7%) Buy: 2021+ (90.0%) 240,189 tests+22.4 pts spread - 09
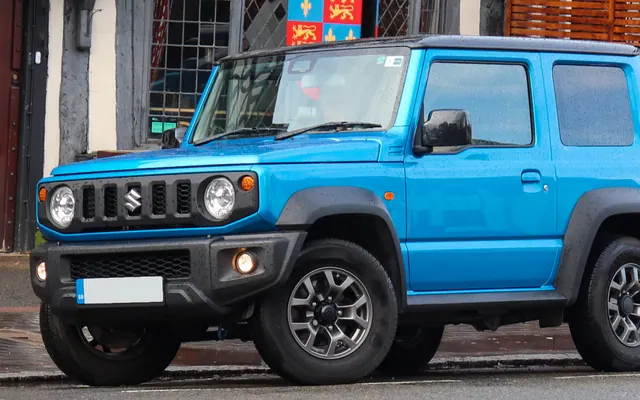
Suzuki Jimny
Avoid: Pre-2018 (72.0%) Buy: 2021+ (93.8%) 42,802 tests+21.8 pts spread - 10

Ldv V80
Avoid: Pre-2018 (65.2%) Buy: 2021+ (86.6%) 4,267 tests+21.4 pts spread - 11

Land Rover Defender
Avoid: Pre-2018 (73.7%) Buy: 2021+ (94.2%) 242,587 tests+20.5 pts spread - 12
Toyota Yaris
Avoid: Pre-2018 (73.5%) Buy: 2021+ (93.5%) 691,473 tests+20.0 pts spread - 13
Renault Scenic
Avoid: Pre-2018 (66.0%) Buy: 2018–2020 (85.9%) 71,475 tests+19.9 pts spread - 14
Kia Rio
Avoid: Pre-2018 (72.9%) Buy: 2021+ (92.5%) 167,559 tests+19.6 pts spread - 15

Nissan Note
Avoid: Pre-2018 (70.8%) Buy: 2018–2020 (90.3%) 256,542 tests+19.5 pts spread - 16
Peugeot 5008
Avoid: Pre-2018 (66.8%) Buy: 2021+ (86.2%) 52,539 tests+19.4 pts spread - 17
Vauxhall Astra
Avoid: Pre-2018 (71.6%) Buy: 2021+ (90.7%) 1,150,896 tests+19.1 pts spread - 18
Peugeot 3008
Avoid: Pre-2018 (71.6%) Buy: 2021+ (90.5%) 234,833 tests+18.9 pts spread - 19
Mazda 3
Avoid: Pre-2018 (72.0%) Buy: 2021+ (90.9%) 188,985 tests+18.9 pts spread - 20
Vauxhall Corsa
Avoid: Pre-2018 (69.7%) Buy: 2021+ (88.6%) 1,531,302 tests+18.9 pts spread - 21

Ssangyong Rexton
Avoid: Pre-2018 (70.1%) Buy: 2021+ (88.9%) 6,668 tests+18.8 pts spread - 22
Renault Megane
Avoid: Pre-2018 (66.0%) Buy: 2021+ (84.7%) 207,851 tests+18.7 pts spread - 23
Nissan Qashqai
Avoid: Pre-2018 (72.0%) Buy: 2021+ (90.7%) 1,004,500 tests+18.7 pts spread - 24

Nissan Nv200
Avoid: Pre-2018 (66.5%) Buy: 2021+ (85.2%) 46,585 tests+18.7 pts spread - 25
SEAT Ibiza
Avoid: Pre-2018 (71.0%) Buy: 2021+ (89.5%) 372,189 tests+18.5 pts spread - 26

Volkswagen Polo
Avoid: Pre-2018 (71.5%) Buy: 2021+ (90.0%) 1,133,725 tests+18.5 pts spread - 27
Mazda 6
Avoid: Pre-2018 (73.1%) Buy: 2021+ (91.5%) 110,633 tests+18.4 pts spread - 28
Toyota Camry
Avoid: Pre-2018 (76.4%) Buy: 2021+ (94.7%) 3,429 tests+18.3 pts spread - 29

Hyundai I30
Avoid: Pre-2018 (70.3%) Buy: 2021+ (88.4%) 183,904 tests+18.1 pts spread - 30
Fiat Hymer
Avoid: Pre-2018 (72.8%) Buy: 2021+ (90.8%) 3,010 tests+18.0 pts spread
How to read this
The spread figure (e.g. +22.1 pts) is the percentage-point gap between the worst and best year band. A 22-point gap on the Mercedes-Benz Vito means a pre-2018 van passes at 70.2% versus 92.3% on 2021+ vans — almost a quarter more failures on the older stock.
What the bands mean
DVSA splits test records into three registration bands: pre-2018, 2018–2020, and 2021+. The 2018 boundary reflects the tightened MOT test that came into force that May. Bands are based on first registration date, not model year.
Source: Driver and Vehicle Standards Agency anonymised MOT test results 2024. Open Government Licence. Minimum 100 tests per band applied to exclude statistical noise. Older cars may carry higher mileage and more accumulated wear — the band comparison does not control for mileage, so some of the gap reflects age as much as build quality.