MOT cost .

Land Rover

Defender

242,587 MOT tests analysed. lands in the middle of the pack — here's where Defenders pass, fail, and end up on the retest sheet.

That's 3.8 points below the UK fleet average across our 1,984 tracked models — buyers should expect more first-time fails than the typical UK car.

Pass

73.7%

Pass-after-fix

4.6%

Fail

20.8%

Avg miles

115,335

Pass + Pass-after-fix + Fail = 100%

Performance by cohort

3 year bands · 242,587 tests

Pass rate climbs 20.5 points across the cohorts — newer Defender examples clear the test more reliably than the early cars.

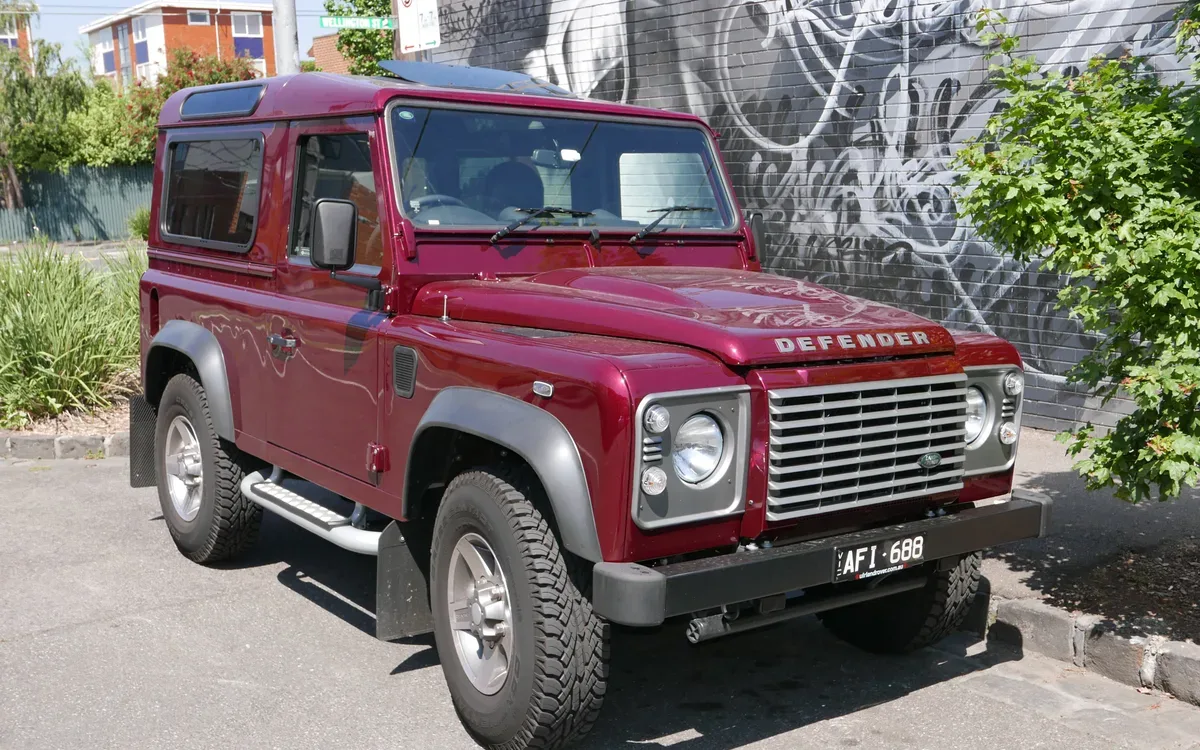
Pre-2018 cohort 242,199

Pass

73.7%

Fail

20.9%

PRS

4.6%

Avg mileage at test

115,454 mi

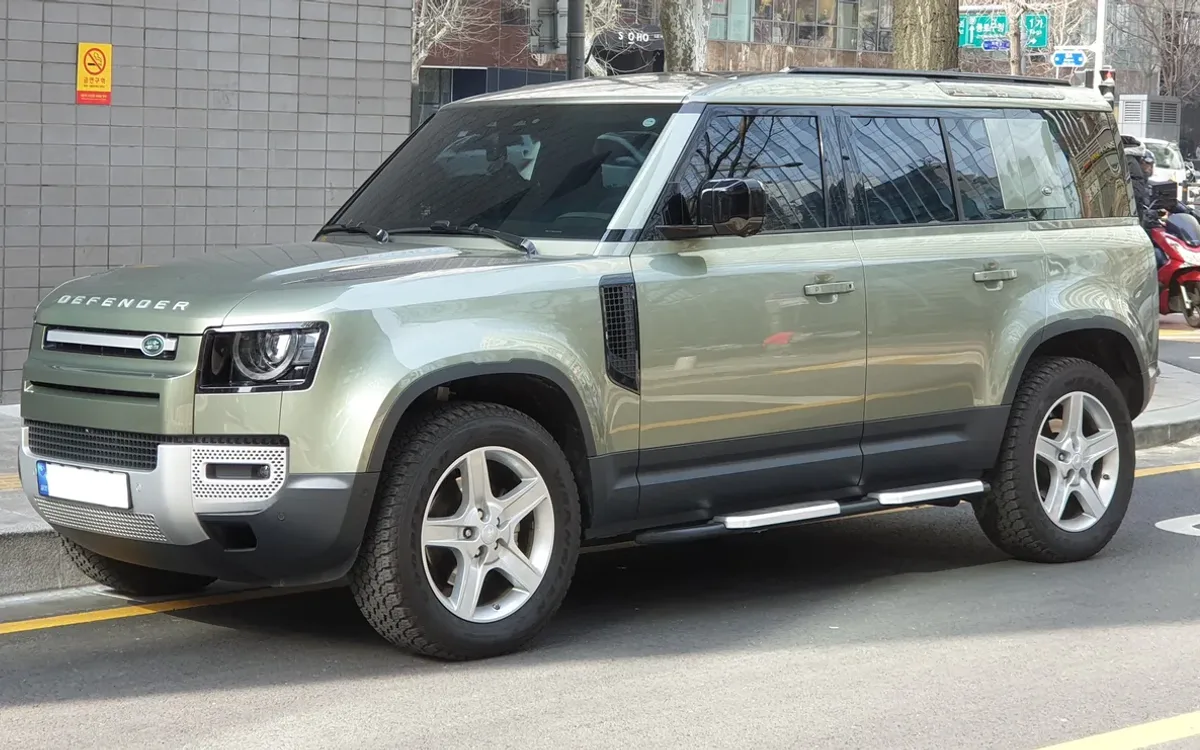
2018–2020 cohort 182

Pass

93.4%

Fail

2.8%

PRS

1.1%

Avg mileage at test

40,139 mi

2021+ cohort 206

Pass

94.2%

Fail

3.9%

PRS

1.5%

Avg mileage at test

40,918 mi

Cohort = vehicle's first-registration year band. Same model, different generations of build.

Generations on file · 2

Land Rover Defender · UK market

Land Rover Defender 1983-2016

19832016

Land Rover Defender 2020-now

2020now

Photos: Wikimedia Commons · CC BY-SA / CC BY / public domain.

The picture

Land Rover Defender: mixed MOT record across 132,856 tests

The Land Rover Defender is a series of British off-road cars and pickup trucks. They have four-wheel drive, and were developed in the 1980s from the Land Rover series which was launched at the Amsterdam Motor Show in April 1948.

MOT data from 132,856 tests puts this car on a 72.7% first-time pass rate, below the UK fleet average. Average mileage at test is 108,224 miles. The most common fail item is steering rack gaiter or ball joint dust cover damaged or deteriorated, followed by worn shock absorber bushes.

Buyers weighing up a used Defender should treat the failure breakdown as a pre-purchase checklist. The pass rate is reasonable, but the gap between first attempt and a clean sheet narrows with age and mileage.

ABI Insurance Group

Group 36–46

A high-group car — insurance costs will be significantly above average. Lower groups cost less to insure; UK fleet average is around Group 22.

Source: ABI Group Rating Panel · administered by Thatcham Research · groups cover standard variants; performance trims may sit higher. Browse all insurance groups →

36–46

out of 50

Compare quotes →

Top ten reasons for rejection.

Filter failures:

  1. 01

    Steering rack gaiter or ball joint dust cover damaged or deteriorated

    8,478 occurrences · 3.5% of tests

  2. 02

    A shock absorber bush excessively worn

    6,336 occurrences · 2.6% of tests

  3. 03

    Windscreen or window damaged or seriously discoloured but not adversely affecting driver's view

    6,330 occurrences · 2.6% of tests

  4. 04

    A lamp missing, inoperative or in the case of a multiple light source more than 1/2 not functioning

    5,707 occurrences · 2.4% of tests

  5. 05

    Brake pipe damaged or excessively corroded

    5,114 occurrences · 2.1% of tests

  6. 06

    The strength or continuity of the load bearing structure within 30cm of any sub-frame, spring or suspension component mounting (a 'prescribed area') is significantly reduced or inadequately repaired

    4,755 occurrences · 2.0% of tests

  7. 07

    Wiper blade missing or obviously not clearing the windscreen

    4,268 occurrences · 1.8% of tests

  8. 08

    An obligatory rear fog lamp missing, or a front or rear fog lamp inoperative or in the case of a multiple light source more than 1/2 not functioning

    4,015 occurrences · 1.7% of tests

  9. 09

    Body, cab or chassis excessively corroded at a mounting point

    3,817 occurrences · 1.6% of tests

  10. 10

    Stop lamp missing, inoperative or in the case of a multiple light source more than 1/2 not functioning

    3,356 occurrences · 1.4% of tests

Counts cover Major and Dangerous defects logged at test. Advisory items excluded so this shows why a car was rejected, not just what the tester flagged in passing.

Worst-case fix budget · top 2 failures

£120£330

If every one of this Defender's most-logged Major fails hit at the same MOT, that's the real-world UK garage range. Reality is usually one or two items, not all of them. Open the estimator →

Try the calculator

Build your own retest budget.

Year-band analysis

Best year to buy. Worst to avoid.

First-time MOT pass rate split by registration band. A 20.5-point gap between bands means the year you buy Land Rover Defender has a real effect on what turns up at the garage.

Best band to buy

94.2%

2021+ registration

the 2021-on band climbs to 94.2% — a 20.5-point improvement. Tests in this band average 40,918 miles — roughly 75K miles fewer on the clock than the older band. Failures here are mostly wear items: has a cut in excess of the…, damaged but not adversely affecting driver's view — the structural issues that drag down older examples don't appear in the top-10 for this band. Post-2020 examples are early in their MOT life and generally show the cleanest records.

Band to be cautious about

73.7%

Pre-2018 registration

On the older band (pre-2018), the data shows a 73.7% pass rate against a fleet average of 94.2% on the newer band. The main culprits logged at test: ball joint dust cover damaged or deteriorated, but preventing the ingress of dirt, has an excessively worn bush, and damaged but not adversely affecting driver's view. Average mileage on test for this band is 115,454 miles — high-mileage wear items are a recurring theme.

Best band to buy: 2021+ (94.2% first-time pass). Worst band to avoid: pre-2018 (73.7% pass). That's a 20.5-point spread across 242,199 older tests and 206 newer ones — year of build makes a material difference on this model.

Year-spread leaderboard →

My Motor World · affiliate

Parts & supplies for this fix

Affiliate links — small commission, no extra cost to you.

Click Mechanic · affiliate

Book a mobile mechanic

Affiliate links — small commission, no extra cost to you.

Mobile mechanic · UK-wide

Book a mechanic at your door.

Fixed-price quotes upfront. No garage needed. Click Mechanic sends a vetted local mechanic to you — home, work, or roadside.

Get a quote →

Recall history

25 UK recalls on record.

The Defender has 25 official UK vehicle recalls covering defect details, remedies, and affected build dates.

See all recalls

Buying or keeping a Defender?

Use the failure ranking as a pre-test checklist or a haggling lever. Treat the headline pass rate as a fleet-wide trend, not a guarantee on any individual car.

If you own a Defender and your last MOT looked nothing like the ranked failures above, that's normal — individual cars vary widely. The ranking shows the patterns testers flag most often across the country.