MOT cost .

Suzuki

Swift

208,359 MOT tests analysed. lands in the middle of the pack — here's where Swifts pass, fail, and end up on the retest sheet.

That's 2.4 points below the UK fleet average across our 1,984 tracked models — buyers should expect more first-time fails than the typical UK car.

Pass

75.1%

Pass-after-fix

6.2%

Fail

18.3%

Avg miles

68,101

Pass + Pass-after-fix + Fail = 100%

Performance by cohort

2 year bands · 208,261 tests

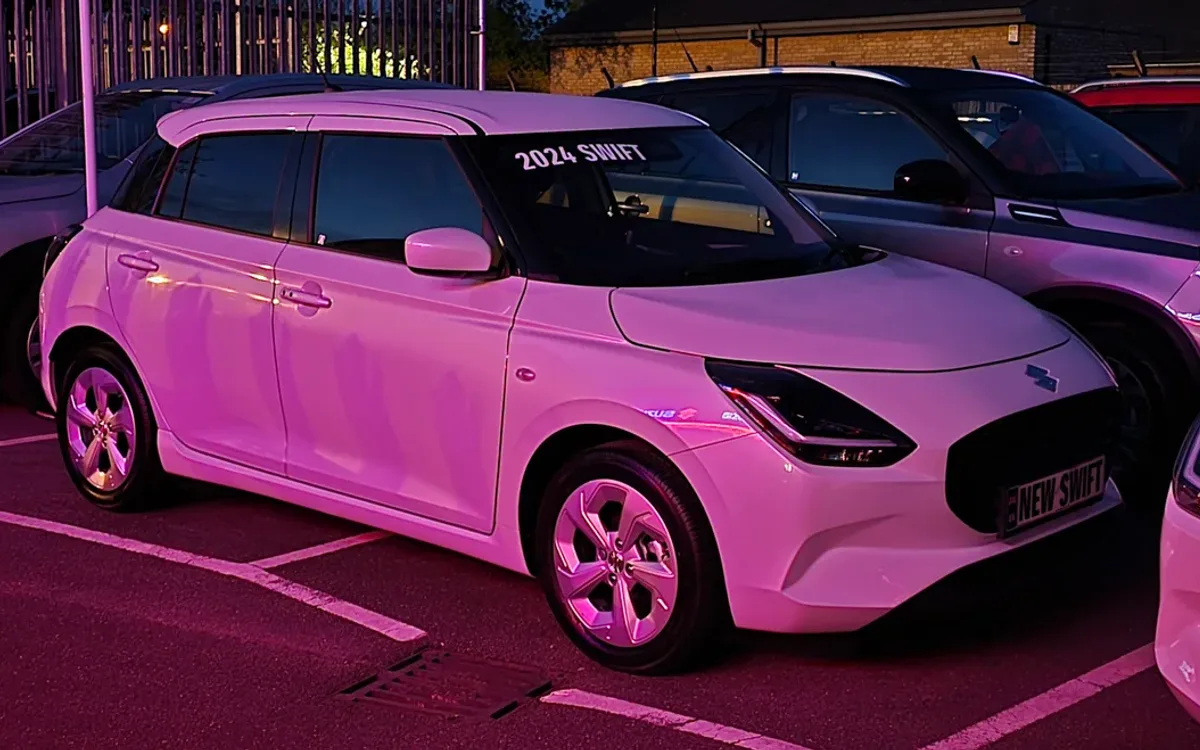
Pass rate climbs 14.9 points across the cohorts — newer Swift examples clear the test more reliably than the early cars.

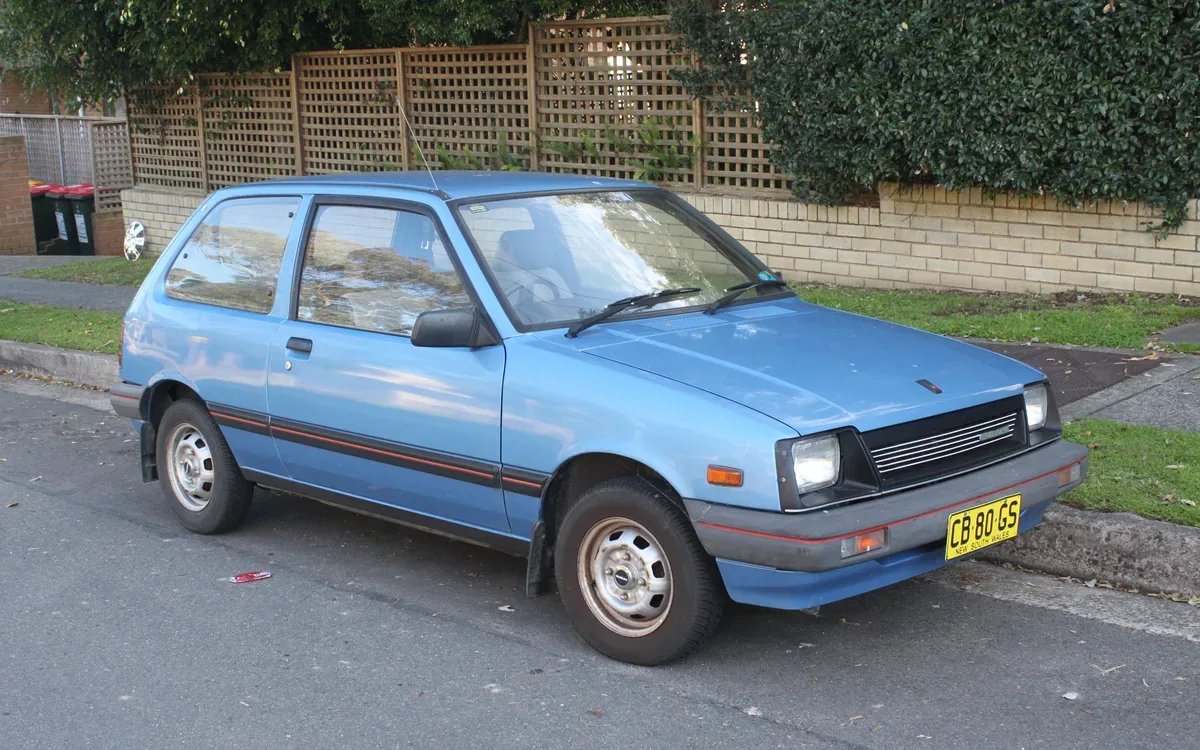
Pre-2018 cohort 178,488

Pass

72.9%

Fail

20.0%

PRS

6.6%

Avg mileage at test

73,792 mi

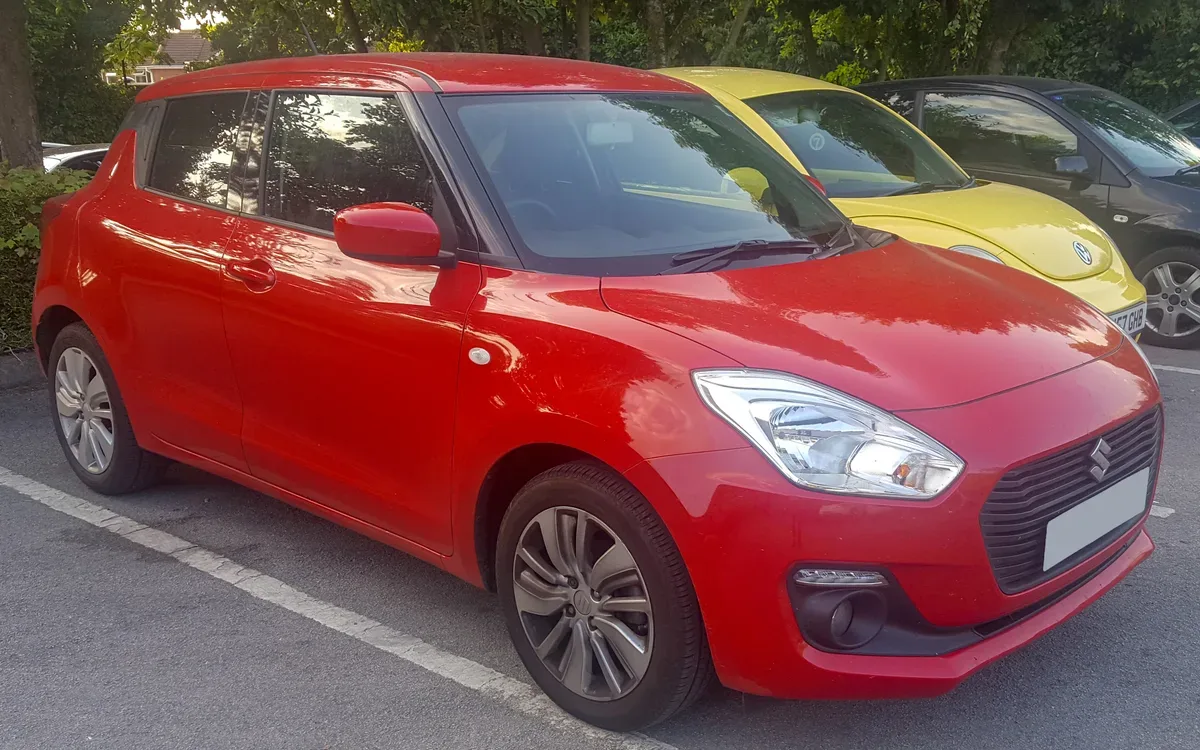
2018–2020 cohort 29,773

Pass

87.9%

Fail

8.0%

PRS

3.9%

Avg mileage at test

34,149 mi

Cohort = vehicle's first-registration year band. Same model, different generations of build.

Generations on file · 6

Suzuki Swift · UK market

Suzuki Swift 1983-1989

19831989

Suzuki Swift 1989-2003

19892003

Suzuki Swift 2004-2010

20042010

Suzuki Swift 2010-2017

20102017

Suzuki Swift 2017-2024

20172024

Suzuki Swift 2024-now

2024now

Photos: Wikimedia Commons · CC BY-SA / CC BY / public domain.

The picture

Suzuki Swift: mixed MOT record across 152,034 tests

The Suzuki Swift is a supermini car (B-segment) produced by Suzuki. The vehicle is classified as a B-segment marque in the European single market, a segment referred to as a supermini in the British Isles.

MOT data from 152,034 tests puts this car on a 75.2% first-time pass rate, roughly in line with the UK fleet average. Average mileage at test is 63,518 miles. The most common fail item is brake pipe damaged or excessively corroded, followed by failed number plate light.

Buyers weighing up a used Swift should treat the failure breakdown as a pre-purchase checklist. The pass rate is reasonable, but the gap between first attempt and a clean sheet narrows with age and mileage.

ABI Insurance Group

Group 4–14

A low-group car — among the cheapest to insure in the UK. Lower groups cost less to insure; UK fleet average is around Group 22.

Source: ABI Group Rating Panel · administered by Thatcham Research · groups cover standard variants; performance trims may sit higher. Browse all insurance groups →

4–14

out of 50

Compare quotes →

Top ten reasons for rejection.

Filter failures:

  1. 01

    A rear registration plate lamp or light source missing or inoperative in the case of multiple lamps or light sources

    7,220 occurrences · 3.5% of tests

  2. 02

    Brake pipe damaged or excessively corroded

    6,730 occurrences · 3.2% of tests

  3. 03

    A lamp missing, inoperative or in the case of a multiple light source more than 1/2 not functioning

    5,296 occurrences · 2.5% of tests

  4. 04

    Tyre tread depth not in accordance with the requirements

    4,360 occurrences · 2.1% of tests

  5. 05

    Windscreen or window damaged or seriously discoloured but not adversely affecting driver's view

    4,301 occurrences · 2.1% of tests

  6. 06

    Wiper blade missing or obviously not clearing the windscreen

    3,812 occurrences · 1.8% of tests

  7. 07

    Stop lamp missing, inoperative or in the case of a multiple light source more than 1/2 not functioning

    3,455 occurrences · 1.7% of tests

  8. 08

    Wiper blade defective

    3,141 occurrences · 1.5% of tests

  9. 09

    A suspension pin, bush or joint excessively worn

    3,136 occurrences · 1.5% of tests

  10. 10

    Parking brake efficiency below minimum requirement

    3,093 occurrences · 1.5% of tests

Counts cover Major and Dangerous defects logged at test. Advisory items excluded so this shows why a car was rejected, not just what the tester flagged in passing.

Worst-case fix budget · top 3 failures

£108£220

If every one of this Swift's most-logged Major fails hit at the same MOT, that's the real-world UK garage range. Reality is usually one or two items, not all of them. Open the estimator →

Try the calculator

Build your own retest budget.

Year-band analysis

Best year to buy. Worst to avoid.

First-time MOT pass rate split by registration band. A 14.9-point gap between bands means the year you buy Suzuki Swift has a real effect on what turns up at the garage.

Best band to buy

87.9%

2018–2020 registration

the 2018–2020 band climbs to 87.9% — a 14.9-point improvement. Tests in this band average 34,149 miles — roughly 40K miles fewer on the clock than the older band. Failures here are mostly wear items: does not clear the windscreen effectively, blade defective — the structural issues that drag down older examples don't appear in the top-10 for this band. The stricter post-2018 MOT test rules meant manufacturers had to tighten up emissions and electrical checks, but this band still shows far fewer major failures on suspension and bodywork than the older fleet.

Band to be cautious about

72.9%

Pre-2018 registration

On the older band (pre-2018), the data shows a 72.9% pass rate against a fleet average of 87.9% on the newer band. The main culprits logged at test: inoperative in the case of multiple lamps…, excessively corroded, and not working. Average mileage on test for this band is 73,792 miles — high-mileage wear items are a recurring theme.

Best band to buy: 2018-2020 (87.9% first-time pass). Worst band to avoid: pre-2018 (72.9% pass). That's a 14.9-point spread across 178,488 older tests and 29,773 newer ones — year of build makes a material difference on this model.

Year-spread leaderboard →

Tools that pre-empt a retest.

Picked against this car's top failure patterns. Affiliate links to Amazon UK — we earn a small cut at no cost to you. Disclosed up-front, doesn't shape the data.

My Motor World · affiliate

Parts & supplies for this fix

Affiliate links — small commission, no extra cost to you.

Click Mechanic · affiliate

Book a mobile mechanic

Affiliate links — small commission, no extra cost to you.

Mobile mechanic · UK-wide

Book a mechanic at your door.

Fixed-price quotes upfront. No garage needed. Click Mechanic sends a vetted local mechanic to you — home, work, or roadside.

Get a quote →

Recall history

19 UK recalls on record.

The Swift has 19 official UK vehicle recalls covering defect details, remedies, and affected build dates.

See all recalls

Buying or keeping a Swift?

Use the failure ranking as a pre-test checklist or a haggling lever. Treat the headline pass rate as a fleet-wide trend, not a guarantee on any individual car.

If you own a Swift and your last MOT looked nothing like the ranked failures above, that's normal — individual cars vary widely. The ranking shows the patterns testers flag most often across the country.