Performance by cohort
3 year bands · 200,425 tests
Pass rate climbs 8.1 points across the cohorts — newer X1 examples clear the test more reliably than the early cars.
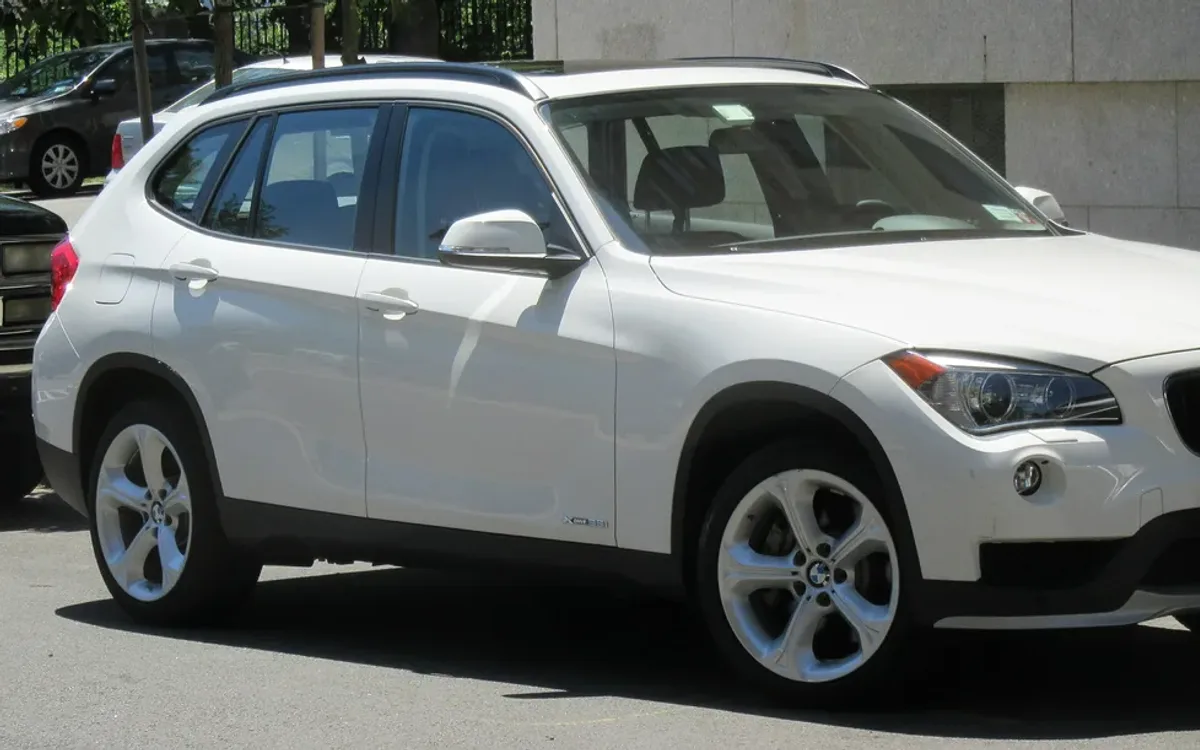
Pre-2018 cohort 132,340
Pass
83.4%
Fail
13.3%
PRS
2.9%
Avg mileage at test
77,599 mi
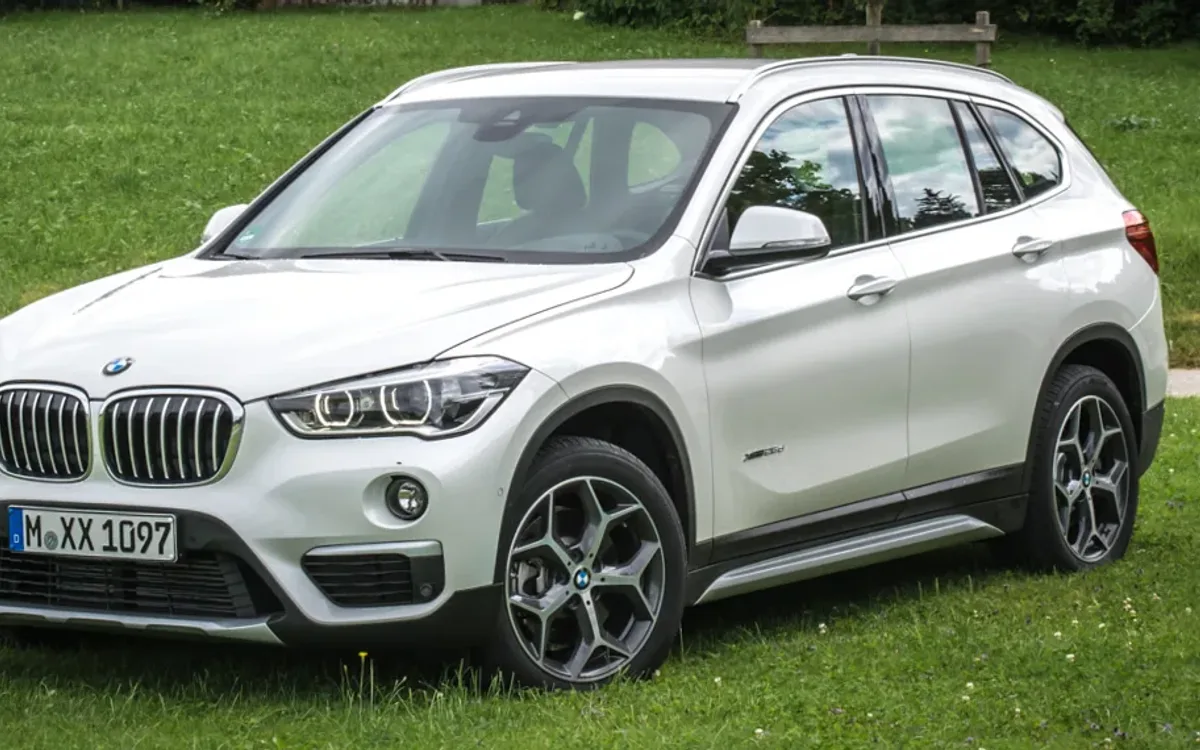
2018–2020 cohort 55,221
Pass
90.8%
Fail
7.0%
PRS
1.9%
Avg mileage at test
37,311 mi
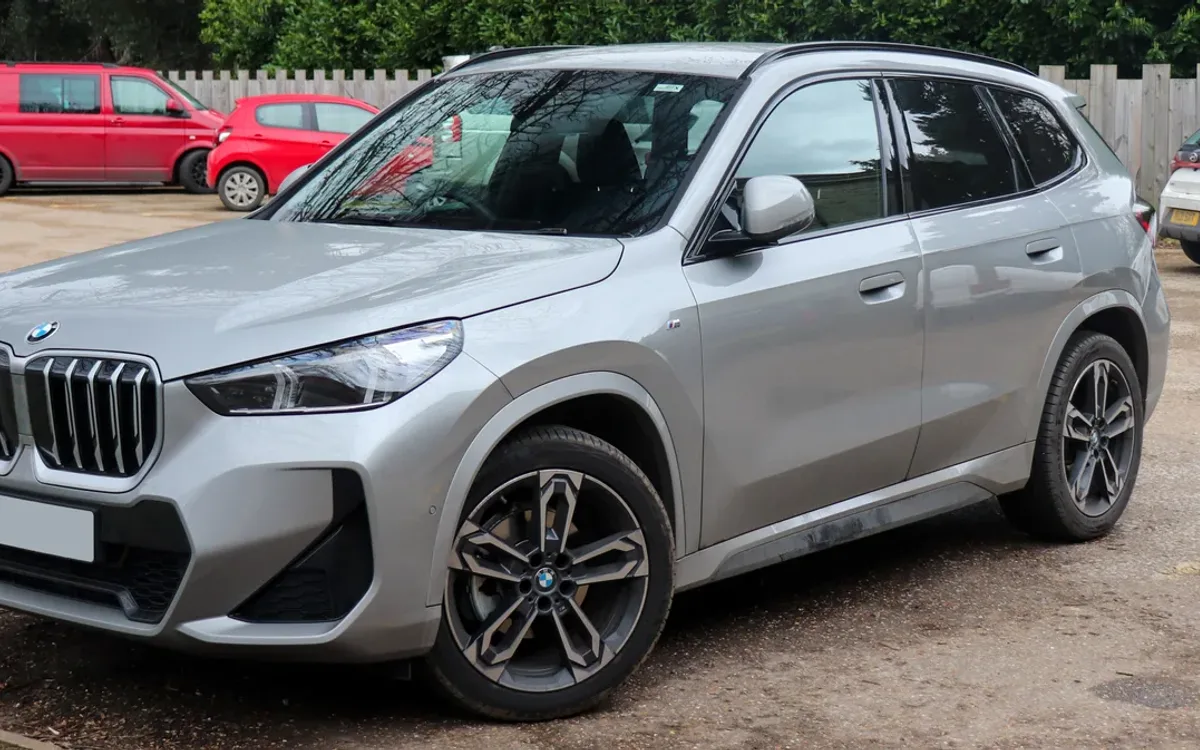
2021+ cohort 12,864
Pass
91.5%
Fail
6.3%
PRS
1.8%
Avg mileage at test
24,043 mi
Cohort = vehicle's first-registration year band. Same model, different generations of build.