MOT cost .

BMW

530

47,106 MOT tests analysed. sits above the UK fleet average — here's where 530s pass, fail, and end up on the retest sheet.

That's 3.8 points above the UK fleet average across our 1,984 tracked models — a confident result.

Pass

81.3%

Pass-after-fix

3.3%

Fail

14.8%

Avg miles

129,097

Pass + Pass-after-fix + Fail = 100%

ULEZ borderline — check VRM

Some examples of this model are borderline — a small number of diesels were certified Euro 6 before September 2015. Check your registration on the government's ULEZ checker to be certain. Daily charges if driven in the zone: London £12.50 · Birmingham £8.00 · Bristol £9.00 .

UK ULEZ & CAZ guide →

Performance by cohort

2 year bands · 47,071 tests

Pass rate climbs 9.7 points across the cohorts — newer 530 examples clear the test more reliably than the early cars.

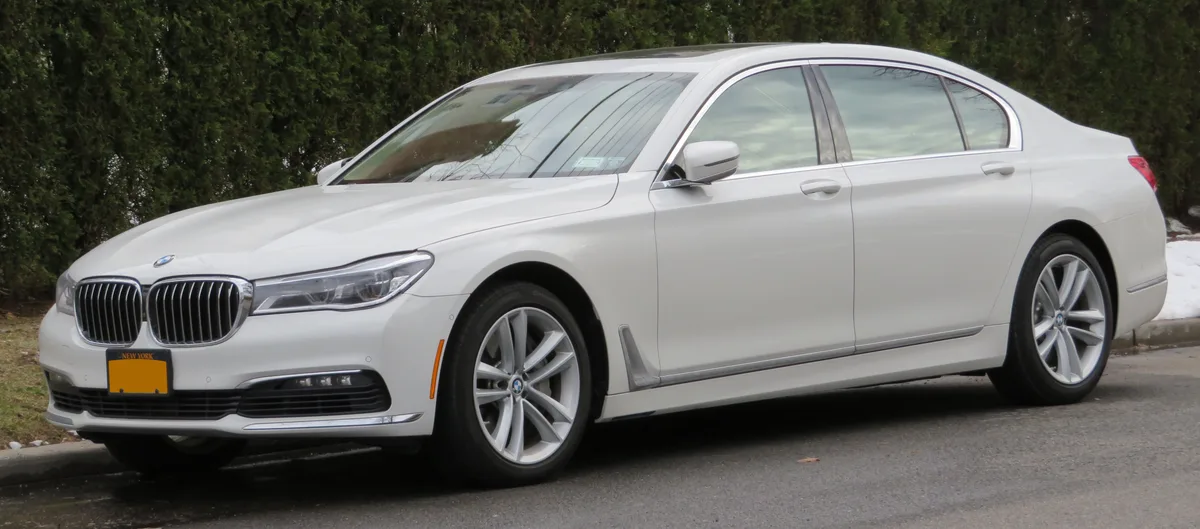
Pre-2018 cohort 46,751

Pass

81.2%

Fail

14.8%

PRS

3.3%

Avg mileage at test

129,732 mi

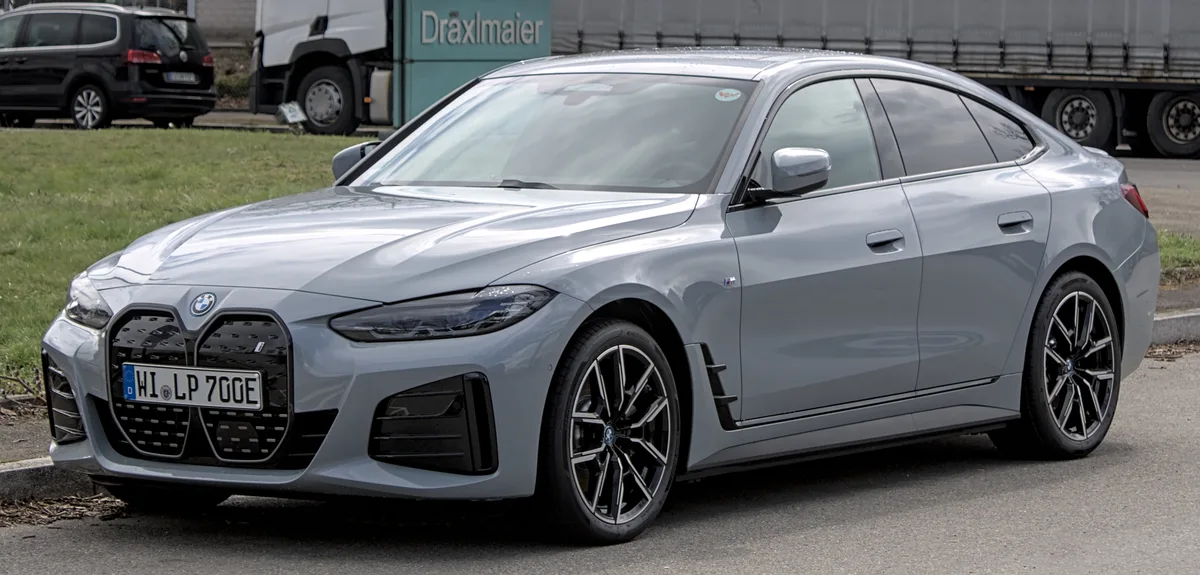
2018–2020 cohort 320

Pass

90.9%

Fail

8.4%

PRS

0.0%

Avg mileage at test

46,554 mi

Cohort = vehicle's first-registration year band. Same model, different generations of build.

Generations on file · 2

BMW 530 · UK market

BMW 530 2015-2022

20152022

BMW 530 null-now

now

Photos: Wikimedia Commons · CC BY-SA / CC BY / public domain.

The picture

BMW 530: mixed MOT record across 29,175 tests

The BMW E12 is the first generation of 5 Series executive cars, which was produced from 1972 to 1981 and replaced the saloon models of the BMW New Class range.

MOT data from 29,175 tests puts this car on a 78.3% first-time pass rate, roughly in line with the UK fleet average. Average mileage at test is 126,596 miles. The most common fail item is cracked or discoloured windscreen, followed by tyre tread below the legal limit.

Buyers weighing up a used 530 should treat the failure breakdown as a pre-purchase checklist. The pass rate is reasonable, but the gap between first attempt and a clean sheet narrows with age and mileage.

ABI Insurance Group

Group 36–46

A high-group car — insurance costs will be significantly above average. Lower groups cost less to insure; UK fleet average is around Group 22.

Source: ABI Group Rating Panel · administered by Thatcham Research · groups cover standard variants; performance trims may sit higher. Browse all insurance groups →

36–46

out of 50

Compare quotes →

Top ten reasons for rejection.

Filter failures:

  1. 01

    Windscreen or window damaged or seriously discoloured but not adversely affecting driver's view

    1,526 occurrences · 3.2% of tests

  2. 02

    Headlamp reflector or lens slightly defective

    861 occurrences · 1.8% of tests

  3. 03

    Tyre tread depth not in accordance with the requirements

    792 occurrences · 1.7% of tests

  4. 04

    A tyre cords visible or damaged

    721 occurrences · 1.5% of tests

  5. 05

    A spring or spring component fractured or seriously weakened

    716 occurrences · 1.5% of tests

  6. 06

    A suspension pin, bush or joint excessively worn

    642 occurrences · 1.4% of tests

  7. 07

    A rear registration plate lamp or light source missing or inoperative in the case of multiple lamps or light sources

    637 occurrences · 1.4% of tests

  8. 08

    A suspension pin, bush or joint excessively worn

    600 occurrences · 1.3% of tests

  9. 09

    A suspension joint dust cover severely deteriorated

    465 occurrences · 1.0% of tests

  10. 10

    A suspension joint dust cover missing or no longer prevents the ingress of dirt etc

    439 occurrences · 0.9% of tests

Counts cover Major and Dangerous defects logged at test. Advisory items excluded so this shows why a car was rejected, not just what the tester flagged in passing.

Worst-case fix budget · top 4 failures

£210£510

If every one of this 530's most-logged Major fails hit at the same MOT, that's the real-world UK garage range. Reality is usually one or two items, not all of them. Open the estimator →

Try the calculator

Build your own retest budget.

Year-band analysis

Best year to buy. Worst to avoid.

First-time MOT pass rate split by registration band. A 9.7-point gap between bands means the year you buy BMW 530 has a real effect on what turns up at the garage.

Best band to buy

90.9%

2018–2020 registration

the 2018–2020 band climbs to 90.9% — a 9.7-point improvement. Tests in this band average 46,554 miles — roughly 83K miles fewer on the clock than the older band. Failures here are mostly wear items: has ply or cords exposed, does not conform to the specified requirements — the structural issues that drag down older examples don't appear in the top-10 for this band. The stricter post-2018 MOT test rules meant manufacturers had to tighten up emissions and electrical checks, but this band still shows far fewer major failures on suspension and bodywork than the older fleet.

Band to be cautious about

81.2%

Pre-2018 registration

On the older band (pre-2018), the data shows a 81.2% pass rate against a fleet average of 90.9% on the newer band. The main culprits logged at test: damaged but not adversely affecting driver's view, lens slightly defective, and tread depth below requirements of 1.6mm. Average mileage on test for this band is 129,732 miles — high-mileage wear items are a recurring theme.

Best band to buy: 2018-2020 (90.9% first-time pass). Worst band to avoid: pre-2018 (81.2% pass). That's a 9.7-point spread across 46,751 older tests and 320 newer ones — year of build makes a material difference on this model.

Year-spread leaderboard →

Tools that pre-empt a retest.

Picked against this car's top failure patterns. Affiliate links to Amazon UK — we earn a small cut at no cost to you. Disclosed up-front, doesn't shape the data.

My Motor World · affiliate

Parts & supplies for this fix

Affiliate links — small commission, no extra cost to you.

Click Mechanic · affiliate

Book a mobile mechanic

Affiliate links — small commission, no extra cost to you.

Mobile mechanic · UK-wide

Book a mechanic at your door.

Fixed-price quotes upfront. No garage needed. Click Mechanic sends a vetted local mechanic to you — home, work, or roadside.

Get a quote →

Buying or keeping a 530?

Use the failure ranking as a pre-test checklist or a haggling lever. Treat the headline pass rate as a fleet-wide trend, not a guarantee on any individual car.

If you own a 530 and your last MOT looked nothing like the ranked failures above, that's normal — individual cars vary widely. The ranking shows the patterns testers flag most often across the country.