Performance by cohort
3 year bands · 141,330 tests
Pass rate climbs 7.0 points across the cohorts — newer 420 examples clear the test more reliably than the early cars.
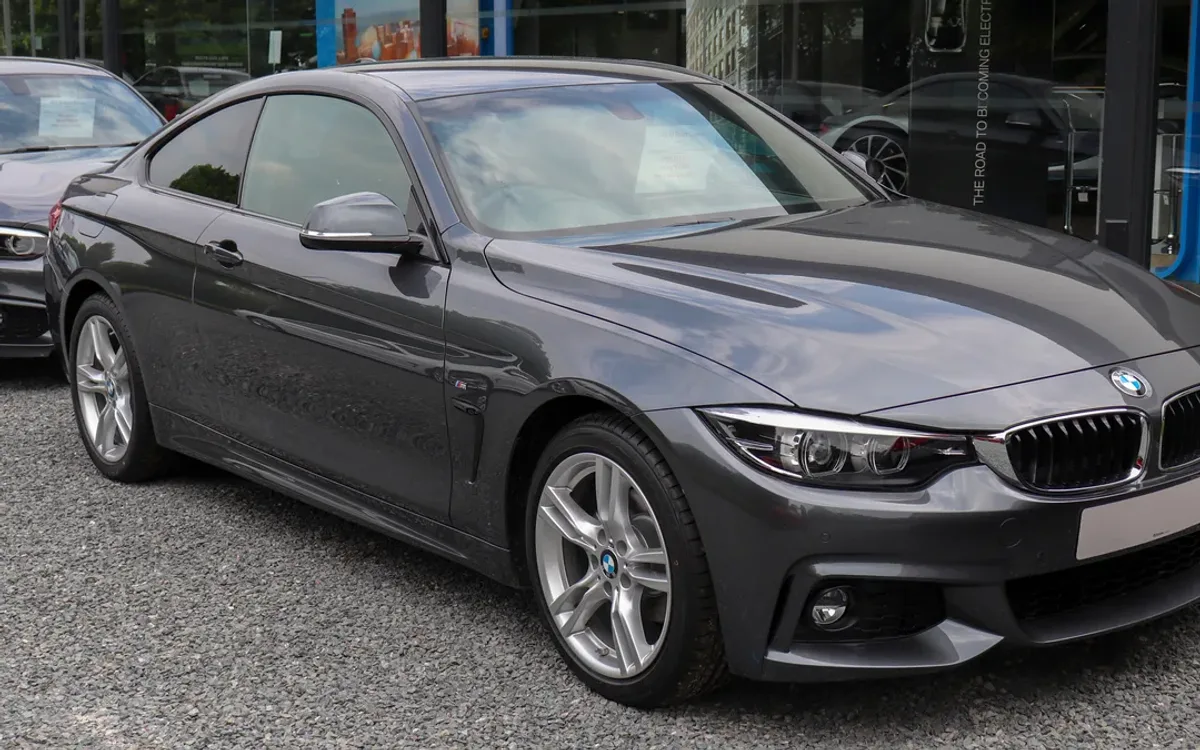
Pre-2018 cohort 102,172
Pass
86.4%
Fail
10.9%
PRS
2.3%
Avg mileage at test
75,655 mi
2018–2020 cohort 38,426
Pass
89.1%
Fail
8.9%
PRS
1.6%
Avg mileage at test
43,324 mi
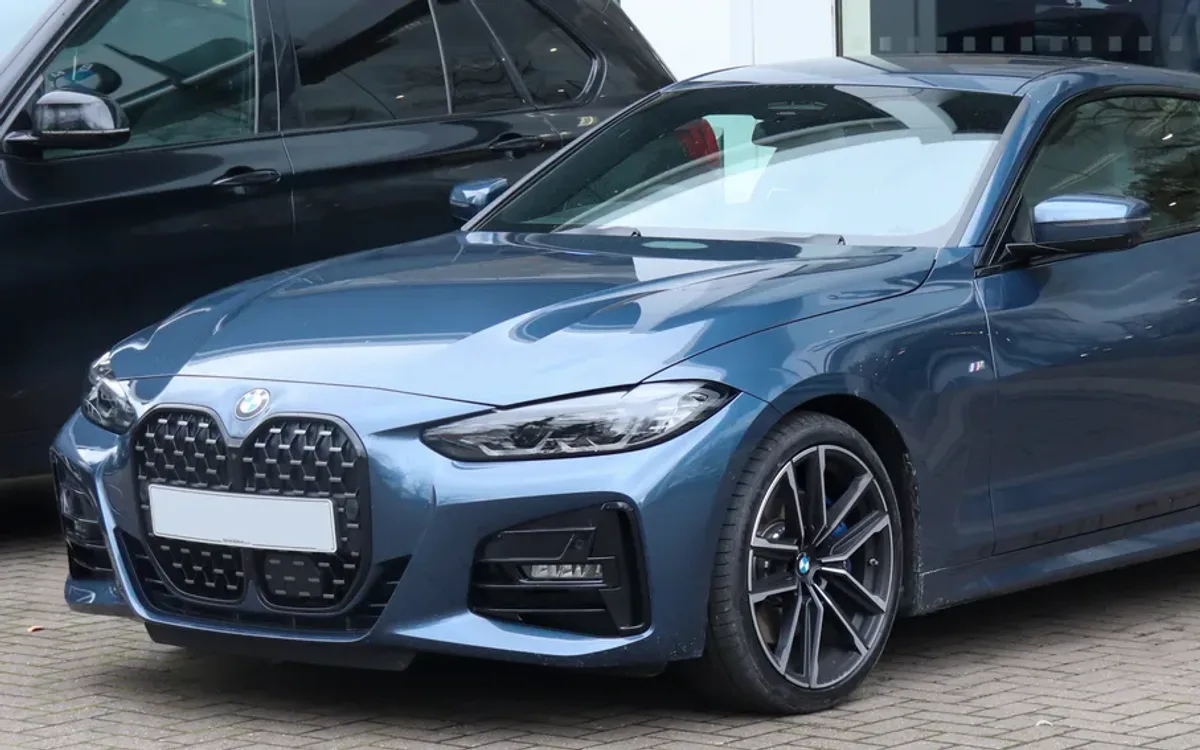
2021+ cohort 732
Pass
93.4%
Fail
5.6%
PRS
1.0%
Avg mileage at test
28,303 mi
Cohort = vehicle's first-registration year band. Same model, different generations of build.