MOT cost .

BMW

330

44,317 MOT tests analysed. sits above the UK fleet average — here's where 330s pass, fail, and end up on the retest sheet.

That's 11.8 points above the UK fleet average across our 1,984 tracked models — a confident result.

Pass

89.3%

Pass-after-fix

1.4%

Fail

8.9%

Avg miles

63,717

Pass + Pass-after-fix + Fail = 100%

ULEZ borderline — check VRM

This model's production run straddles the January 2006 Euro 4 cutoff. Individual cars vary — check your registration plate on the government's ULEZ checker. Daily charges if driven in the zone: London £12.50 · Birmingham £8.00 .

UK ULEZ & CAZ guide →

Performance by cohort

3 year bands · 44,317 tests

Pass rate climbs 2.4 points across the cohorts — newer 330 examples clear the test more reliably than the early cars.

Pre-2018 cohort 18,947

Pass

88.4%

Fail

9.6%

PRS

1.6%

Avg mileage at test

76,733 mi

2018–2020 cohort 24,895

Pass

89.9%

Fail

8.3%

PRS

1.4%

Avg mileage at test

54,283 mi

2021+ cohort 475

Pass

90.7%

Fail

8.2%

PRS

0.6%

Avg mileage at test

39,658 mi

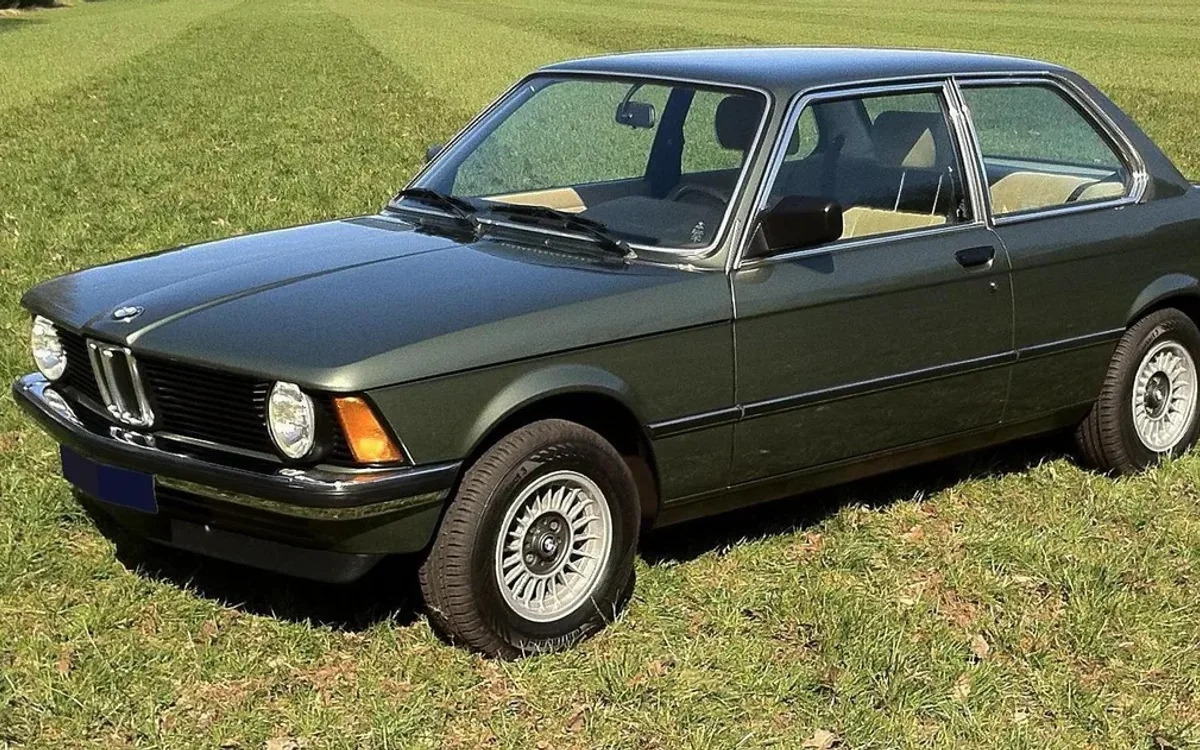
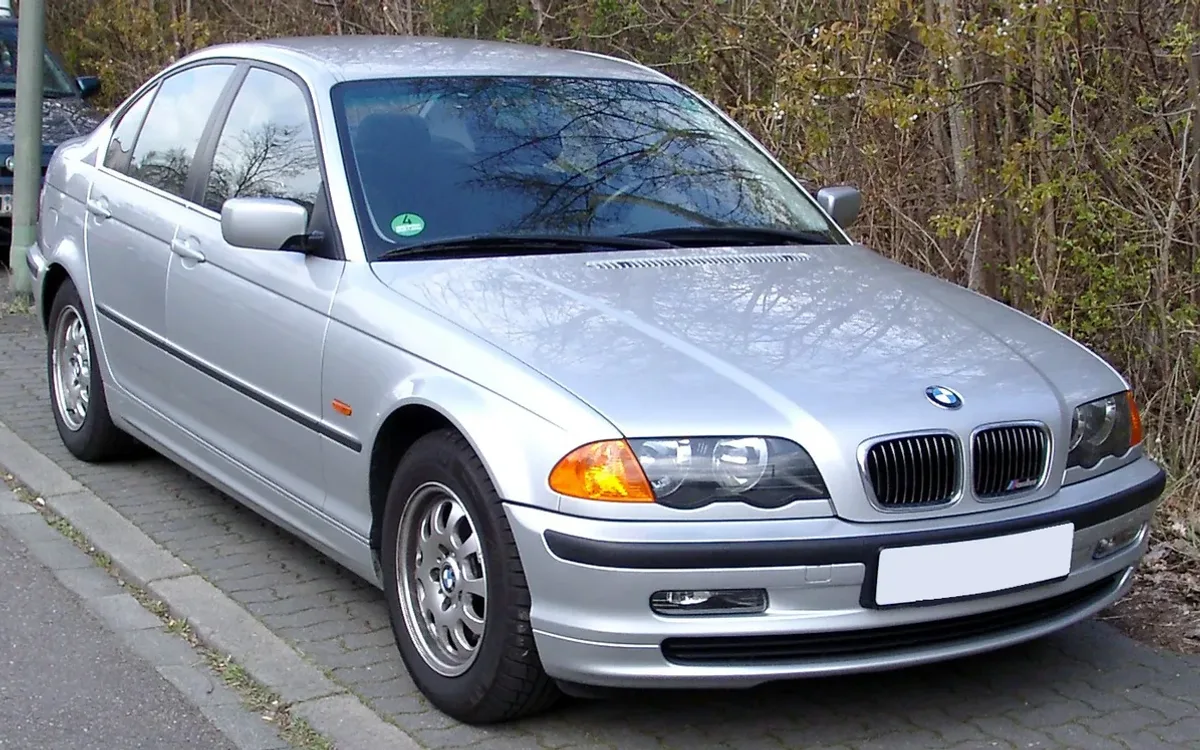
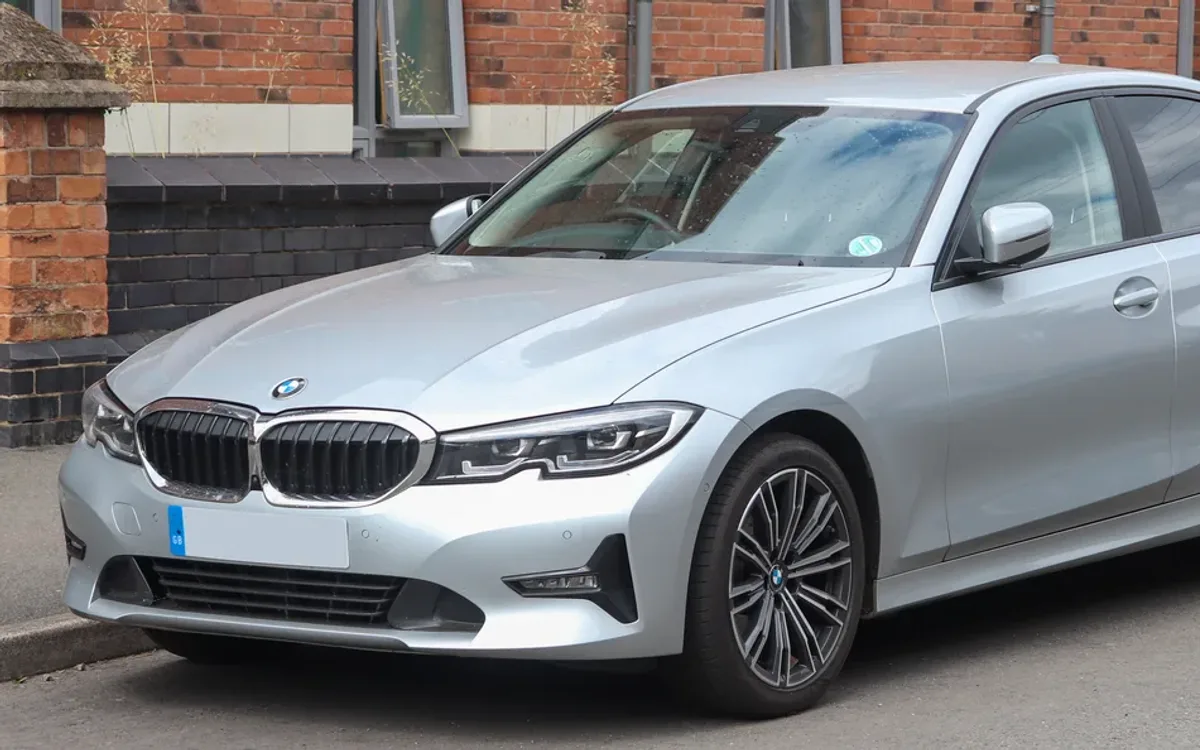
Cohort = vehicle's first-registration year band. Same model, different generations of build.

Generations on file · 3

BMW 330 · UK market

BMW 330 1975-1983

19751983

BMW 330 1998-2006

19982006

BMW 330 2018-now

2018now

Photos: Wikimedia Commons · CC BY-SA / CC BY / public domain.

The picture

BMW 330: solid MOT record across 23,861 tests

The BMW 3 series is a line of compact executive cars manufactured by the German automaker BMW since May 1975. It is the successor to the 02 series and has been produced in eight generations.

MOT data from 23,861 tests puts this car on an 86.7% first-time pass rate, well above the UK fleet average. Average mileage at test is 54,971 miles. The most common fail item is damaged tyre sidewall or structure, followed by cracked or discoloured windscreen.

For used buyers, the 330's pass rate suggests it clears the MOT with fewer surprises than most — but the top failure items above are still worth a pre-purchase inspection, particularly on higher-mileage examples.

ABI Insurance Group

Group 32–44

A high-group car — insurance costs will be significantly above average. Lower groups cost less to insure; UK fleet average is around Group 22.

Source: ABI Group Rating Panel · administered by Thatcham Research · groups cover standard variants; performance trims may sit higher. Browse all insurance groups →

32–44

out of 50

Compare quotes →

Top ten reasons for rejection.

Filter failures:

  1. 01

    Windscreen or window damaged or seriously discoloured but not adversely affecting driver's view

    802 occurrences · 1.8% of tests

  2. 02

    Tyre tread depth not in accordance with the requirements

    788 occurrences · 1.8% of tests

  3. 03

    A tyre seriously damaged

    618 occurrences · 1.4% of tests

  4. 04

    A tyre cords visible or damaged

    480 occurrences · 1.1% of tests

  5. 05

    A tyre seriously damaged

    477 occurrences · 1.1% of tests

  6. 06

    Wiper blade defective

    230 occurrences · 0.5% of tests

  7. 07

    A shock absorber damaged to the extent that it does not function or showing signs of severe leakage

    186 occurrences · 0.4% of tests

  8. 08

    A suspension pin, bush or joint excessively worn

    148 occurrences · 0.3% of tests

  9. 09

    Windscreen washers not working or not providing sufficient fluid to clear the windscreen

    138 occurrences · 0.3% of tests

  10. 10

    a brake lining or pad worn below 1.5mm

    134 occurrences · 0.3% of tests

Counts cover Major and Dangerous defects logged at test. Advisory items excluded so this shows why a car was rejected, not just what the tester flagged in passing.

Worst-case fix budget · top 2 failures

£120£190

If every one of this 330's most-logged Major fails hit at the same MOT, that's the real-world UK garage range. Reality is usually one or two items, not all of them. Open the estimator →

Try the calculator

Build your own retest budget.

Year-band analysis

Best year to buy. Worst to avoid.

First-time MOT pass rate split by registration band. A 2.4-point gap between bands is modest — the year you buy BMW 330 makes a small but real difference to MOT outcomes.

Best band to buy

90.7%

2021+ registration

the 2021-on band climbs to 90.7% — a 2.4-point improvement. Tests in this band average 39,658 miles — roughly 37K miles fewer on the clock than the older band. Failures here are mostly wear items: tread depth below requirements of 1.6mm, has a cut in excess of the… — the structural issues that drag down older examples don't appear in the top-10 for this band. Post-2020 examples are early in their MOT life and generally show the cleanest records.

Band to be cautious about

88.4%

Pre-2018 registration

On the older band (pre-2018), the data shows a 88.4% pass rate against a fleet average of 90.7% on the newer band. The main culprits logged at test: damaged but not adversely affecting driver's view, tread depth below requirements of 1.6mm, and has ply or cords exposed. Average mileage on test for this band is 76,733 miles — high-mileage wear items are a recurring theme.

Best band to buy: 2021+ (90.7% first-time pass). Worst band to avoid: pre-2018 (88.4% pass). That's a 2.4-point spread across 18,947 older tests and 475 newer ones — year of build makes a material difference on this model.

Year-spread leaderboard →

Tools that pre-empt a retest.

Picked against this car's top failure patterns. Affiliate links to Amazon UK — we earn a small cut at no cost to you. Disclosed up-front, doesn't shape the data.

My Motor World · affiliate

Parts & supplies for this fix

Affiliate links — small commission, no extra cost to you.

Click Mechanic · affiliate

Book a mobile mechanic

Affiliate links — small commission, no extra cost to you.

Mobile mechanic · UK-wide

Book a mechanic at your door.

Fixed-price quotes upfront. No garage needed. Click Mechanic sends a vetted local mechanic to you — home, work, or roadside.

Get a quote →

Buying or keeping a 330?

Use the failure ranking as a pre-test checklist or a haggling lever. Treat the headline pass rate as a fleet-wide trend, not a guarantee on any individual car.

If you own a 330 and your last MOT looked nothing like the ranked failures above, that's normal — individual cars vary widely. The ranking shows the patterns testers flag most often across the country.