MOT cost .

Smart (mcc)

Fortwo

41,545 MOT tests analysed. sits above the UK fleet average — here's where Fortwos pass, fail, and end up on the retest sheet.

That's 5.7 points above the UK fleet average across our 1,984 tracked models — a confident result.

Pass

83.2%

Pass-after-fix

4.4%

Fail

12.0%

Avg miles

37,720

Pass + Pass-after-fix + Fail = 100%

Performance by cohort

2 year bands · 41,545 tests

Pass rate climbs 5.8 points across the cohorts — newer Fortwo examples clear the test more reliably than the early cars.

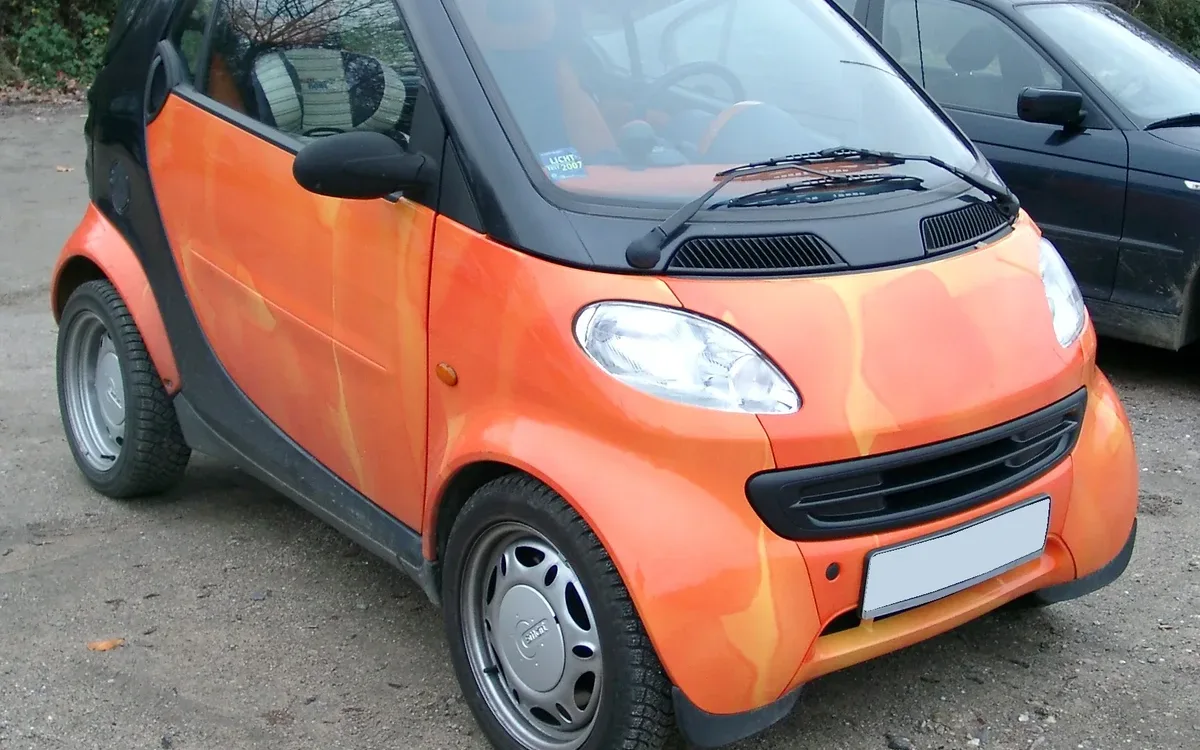
Pre-2018 cohort 33,857

Pass

82.1%

Fail

12.8%

PRS

4.7%

Avg mileage at test

40,316 mi

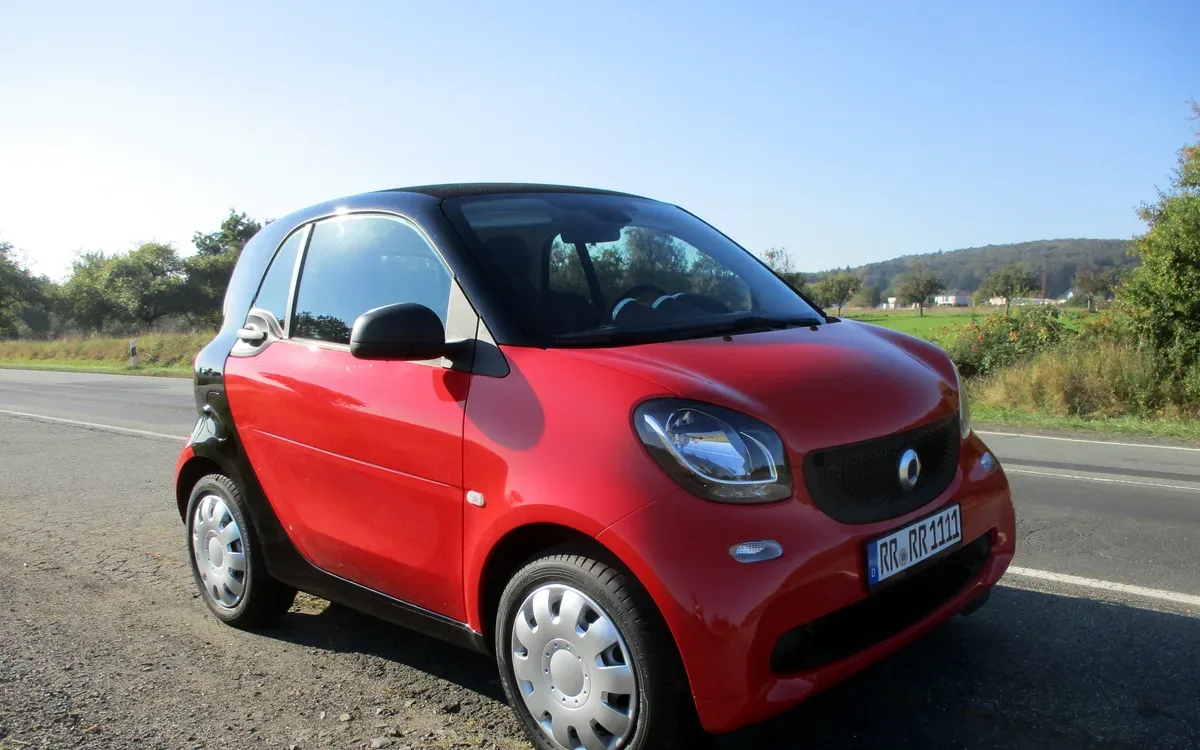
2018–2020 cohort 7,688

Pass

88.0%

Fail

8.5%

PRS

3.3%

Avg mileage at test

26,308 mi

Cohort = vehicle's first-registration year band. Same model, different generations of build.

Generations on file · 3

Smart (mcc) Fortwo · UK market

Smart (mcc) Fortwo 1998-2007

19982007

Smart (mcc) Fortwo 2007-2014

20072014

Smart (mcc) Fortwo 2014-2020

20142020

Photos: Wikimedia Commons · CC BY-SA / CC BY / public domain.

The picture

Smart (mcc) Fortwo: solid MOT record across 25,719 tests

The Smart (mcc) Fortwo is a petrol-powered car sold in the UK market across multiple generations, covering a broad date range in the test population.

MOT data from 25,719 tests puts this car on a 83.3% first-time pass rate, above the UK fleet average. Average mileage at test is 33,580 miles. The most common fail item is inoperative wiper blade, followed by tyre tread below the legal limit.

Kia EV5 Well-equipped and spacious interior. Easy to drive. Kia's excellent seven-year warranty. Read more.

For used buyers, the Fortwo's pass rate suggests it clears the MOT with fewer surprises than most — but the top failure items above are still worth a pre-purchase inspection, particularly on higher-mileage examples.

Top ten reasons for rejection.

Filter failures:

  1. 01

    Tyre tread depth not in accordance with the requirements

    752 occurrences · 1.8% of tests

  2. 02

    Wiper blade missing or obviously not clearing the windscreen

    612 occurrences · 1.5% of tests

  3. 03

    Windscreen or window damaged or seriously discoloured but not adversely affecting driver's view

    607 occurrences · 1.5% of tests

  4. 04

    a brake lining or pad worn below 1.5mm

    501 occurrences · 1.2% of tests

  5. 05

    A rear registration plate lamp or light source missing or inoperative in the case of multiple lamps or light sources

    480 occurrences · 1.2% of tests

  6. 06

    Wiper blade defective

    435 occurrences · 1.0% of tests

  7. 07

    Lambda coefficient outside the default limits or the range specified by the manufacturer

    389 occurrences · 0.9% of tests

  8. 08

    Stop lamp missing, inoperative or in the case of a multiple light source more than 1/2 not functioning

    331 occurrences · 0.8% of tests

  9. 09

    A tyre seriously damaged

    323 occurrences · 0.8% of tests

  10. 10

    A spring or spring component fractured or seriously weakened

    266 occurrences · 0.6% of tests

Counts cover Major and Dangerous defects logged at test. Advisory items excluded so this shows why a car was rejected, not just what the tester flagged in passing.

Worst-case fix budget · top 4 failures

£168£335

If every one of this Fortwo's most-logged Major fails hit at the same MOT, that's the real-world UK garage range. Reality is usually one or two items, not all of them. Open the estimator →

Try the calculator

Build your own retest budget.

Year-band analysis

Best year to buy. Worst to avoid.

First-time MOT pass rate split by registration band. A 5.8-point gap between bands means the year you buy Smart (mcc) Fortwo has a real effect on what turns up at the garage.

Best band to buy

88.0%

2018–2020 registration

the 2018–2020 band climbs to 88.0% — a 5.8-point improvement. Tests in this band average 26,308 miles — roughly 14K miles fewer on the clock than the older band. Failures here are mostly wear items: tread depth below requirements of 1.6mm, does not clear the windscreen effectively — the structural issues that drag down older examples don't appear in the top-10 for this band. The stricter post-2018 MOT test rules meant manufacturers had to tighten up emissions and electrical checks, but this band still shows far fewer major failures on suspension and bodywork than the older fleet.

Band to be cautious about

82.1%

Pre-2018 registration

On the older band (pre-2018), the data shows a 82.1% pass rate against a fleet average of 88.0% on the newer band. The main culprits logged at test: tread depth below requirements of 1.6mm, damaged but not adversely affecting driver's view, and does not clear the windscreen effectively. Average mileage on test for this band is 40,316 miles — high-mileage wear items are a recurring theme.

Best band to buy: 2018-2020 (88.0% first-time pass). Worst band to avoid: pre-2018 (82.1% pass). That's a 5.8-point spread across 33,857 older tests and 7,688 newer ones — year of build makes a material difference on this model.

Year-spread leaderboard →

Tools that pre-empt a retest.

Picked against this car's top failure patterns. Affiliate links to Amazon UK — we earn a small cut at no cost to you. Disclosed up-front, doesn't shape the data.

My Motor World · affiliate

Parts & supplies for this fix

Affiliate links — small commission, no extra cost to you.

Click Mechanic · affiliate

Book a mobile mechanic

Affiliate links — small commission, no extra cost to you.

Mobile mechanic · UK-wide

Book a mechanic at your door.

Fixed-price quotes upfront. No garage needed. Click Mechanic sends a vetted local mechanic to you — home, work, or roadside.

Get a quote →

Owner reports · Honest John

What owners actually report.

Verbatim faults logged by owners on honestjohn.co.uk over recent years. We didn't summarise — these are the words people typed in.

What's good

Kia EV5 Well-equipped and spacious interior. Easy to drive. Kia's excellent seven-year warranty. Read more

Buying or keeping a Fortwo?

Use the failure ranking as a pre-test checklist or a haggling lever. Treat the headline pass rate as a fleet-wide trend, not a guarantee on any individual car.

If you own a Fortwo and your last MOT looked nothing like the ranked failures above, that's normal — individual cars vary widely. The ranking shows the patterns testers flag most often across the country.