Performance by cohort
3 year bands · 77,122 tests
Pass rate climbs 14.9 points across the cohorts — newer Leaf examples clear the test more reliably than the early cars.
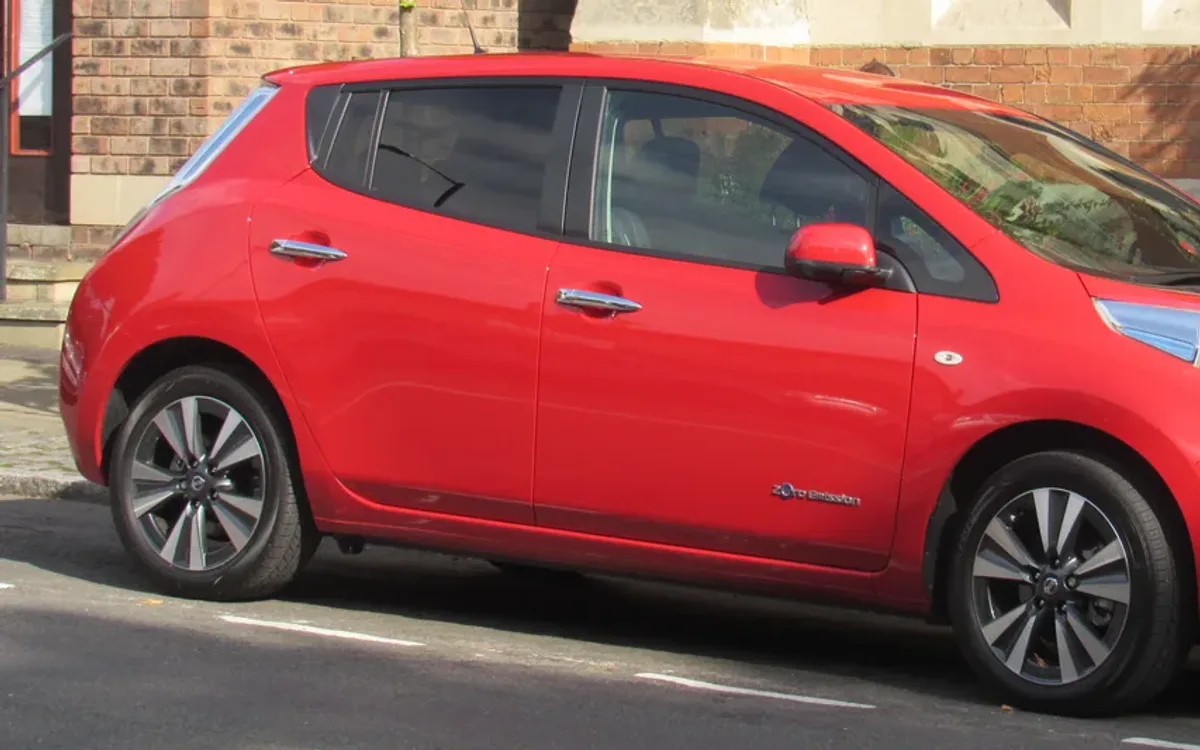
Pre-2018 cohort 35,826
Pass
77.0%
Fail
19.6%
PRS
2.9%
Avg mileage at test
58,148 mi
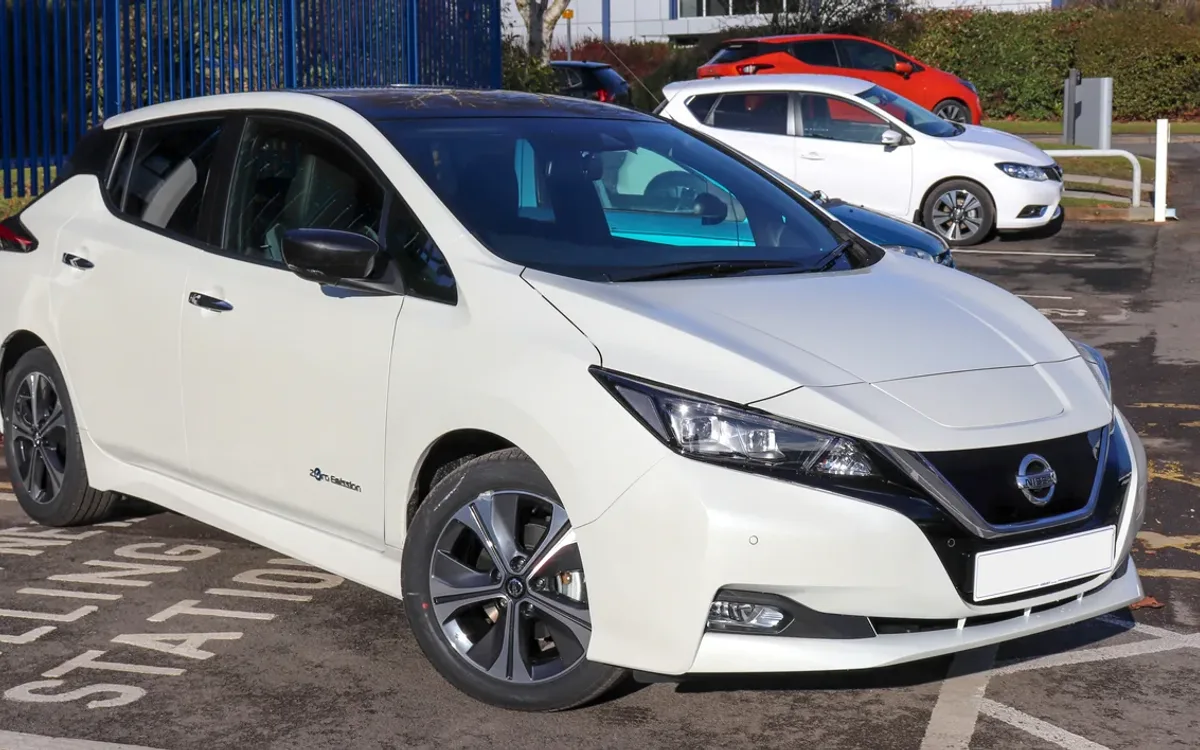
2018–2020 cohort 26,280
Pass
88.5%
Fail
8.7%
PRS
2.5%
Avg mileage at test
37,852 mi
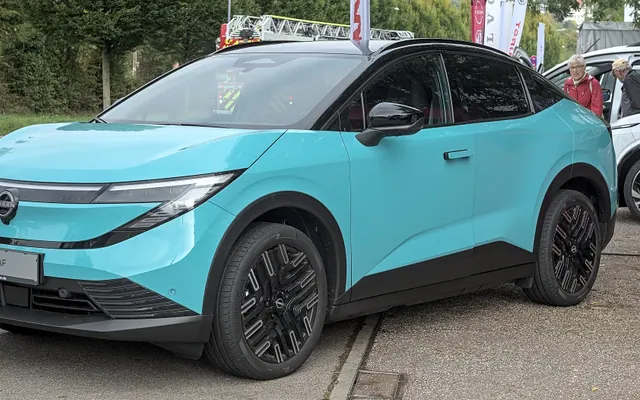
2021+ cohort 15,016
Pass
91.9%
Fail
5.6%
PRS
2.1%
Avg mileage at test
23,698 mi
Cohort = vehicle's first-registration year band. Same model, different generations of build.