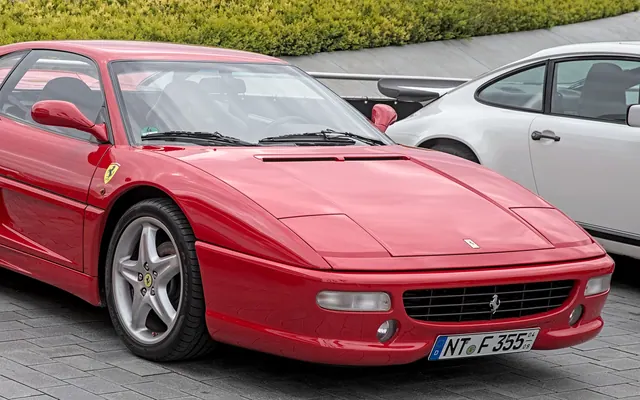
Ferrari
F355
2,081 MOT tests analysed. sits above the UK fleet average — here's where F355s pass, fail, and end up on the retest sheet.
That's 15.0 points above the UK fleet average across our 1,984 tracked models — a confident result.
Pass
92.5%
Pass-after-fix
2.2%
Fail
4.8%
Avg miles
34,983
Pass + Pass-after-fix + Fail = 100%
This model's production run straddles the January 2006 Euro 4 cutoff. Individual cars vary — check your registration plate on the government's ULEZ checker. Daily charges if driven in the zone: London £12.50 · Birmingham £8.00 .
The picture
F355: a strong MOT record by UK norms
Across 749 MOT tests, the F355 returns 92.1% first-time pass — comfortably ahead of the UK fleet average. The single most-logged Major fail is lambda coefficient outside the default limits. Emissions levels exceed the manufacturer's specified limits and a missing steering gaiter round out the top three. Average tested mileage sits at 34,675, which is the lens to read those failure rankings through. If you own one and the next test is close, the ranked list below is a sensible pre-test checklist.
ABI Insurance Group
Group 50
A high-group car — insurance costs will be significantly above average. Lower groups cost less to insure; UK fleet average is around Group 22.
Source: ABI Group Rating Panel · administered by Thatcham Research · groups cover standard variants; performance trims may sit higher. Browse all insurance groups →
50
out of 50
Top ten reasons for rejection.
Filter failures:
Hide categories
Tick a category to hide it from rankings sitewide. Saved in this browser only.
- 01
Lambda coefficient outside the default limits or the range specified by the manufacturer
35 occurrences · 1.7% of tests
- 02
Steering rack gaiter or ball joint dust cover damaged or deteriorated
21 occurrences · 1.0% of tests
- 03
A lamp missing, inoperative or in the case of a multiple light source more than 1/2 not functioning
19 occurrences · 0.9% of tests
- 04
Emissions levels exceed default limits
14 occurrences · 0.7% of tests
- 05
Emissions levels exceed the manufacturer's specified limits
14 occurrences · 0.7% of tests
- 06
Emissions test unable to be completed
13 occurrences · 0.6% of tests
- 07
Parking brake efficiency below minimum requirement
11 occurrences · 0.5% of tests
- 08
Emissions levels exceed default limits
11 occurrences · 0.5% of tests
- 09
Steering rack gaiter or ball joint dust cover missing or no longer prevents the ingress of dirt etc
10 occurrences · 0.5% of tests
- 10
A rear registration plate lamp or light source missing or inoperative in the case of a single lamp or all lamps
7 occurrences · 0.3% of tests
Counts cover Major and Dangerous defects logged at test. Advisory items excluded so this shows why a car was rejected, not just what the tester flagged in passing.
Try the calculator
Build your own retest budget.
My Motor World · affiliate
Parts & supplies for this fix
Affiliate links — small commission, no extra cost to you.


Click Mechanic · affiliate
Book a mobile mechanic
Affiliate links — small commission, no extra cost to you.
Mobile mechanic · UK-wide
Book a mechanic at your door.
Fixed-price quotes upfront. No garage needed. Click Mechanic sends a vetted local mechanic to you — home, work, or roadside.
Recall history
4 UK recalls on record.
The F355 has 4 official UK vehicle recalls covering defect details, remedies, and affected build dates.
Buying or keeping an F355?
Use the failure ranking as a pre-test checklist or a haggling lever. Treat the headline pass rate as a fleet-wide trend, not a guarantee on any individual car.
If you own an F355 and your last MOT looked nothing like the ranked failures above, that's normal — individual cars vary widely. The ranking shows the patterns testers flag most often across the country.