Fuel comparison
Petrol vs diesel, at the MOT bay.
Petrol cars pass first time at 77.2%. Diesels run 77.0%. Across 61,146,299 tests last year, that's a 0.2-point gap and the two segments draw.
Petrol
77.2%
first-time pass rate
Tests
32,592,230
Avg mileage
69k
Models
1,325
Diesel
77.0%
first-time pass rate
Tests
28,554,069
Avg mileage
90k
Models
830
The headline gap reads larger than it is. UK diesels at the MOT bay are an older fleet — average mileage at test is 90k versus 69k for petrol. Newer petrol stock skews the petrol number up; diesel particulate filters and EGR valves on long-mileage cars skew the diesel number down. Year-on-year the gap is closing, not widening.
Same model, different fuel — who wins?
Models that sell in meaningful volume on both fuels (5,000+ UK tests on each variant). Pass rate is for the model overall — fuel-specific splits coming when the year-band ETL lands.
- 01
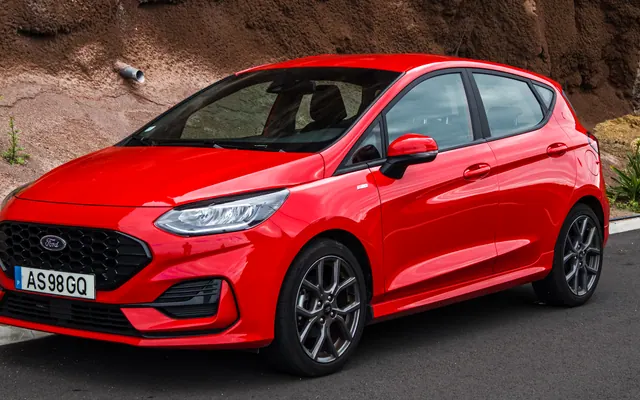
Ford Fiesta
2,488,311 tests · 72.3% pass
Petrol
2,134,212
Diesel
353,989
- 02
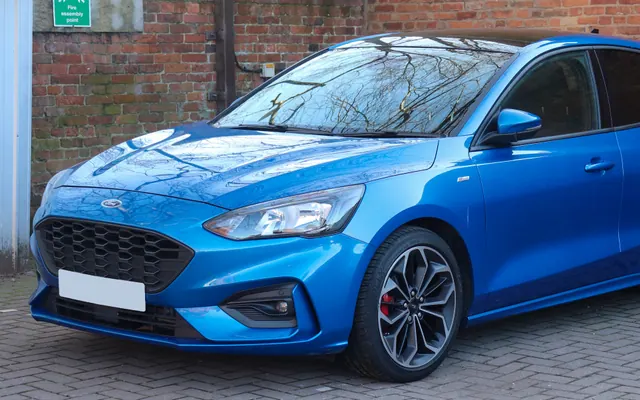
Ford Focus
1,667,364 tests · 74.2% pass
Petrol
1,119,711
Diesel
547,540
- 03
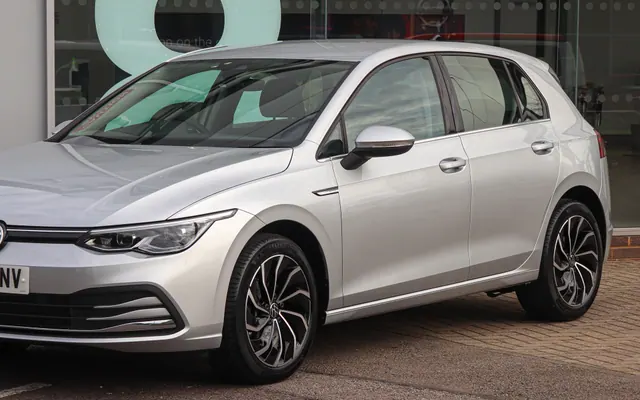
Volkswagen Golf
1,593,075 tests · 78.6% pass
Petrol
773,488
Diesel
799,671
- 04
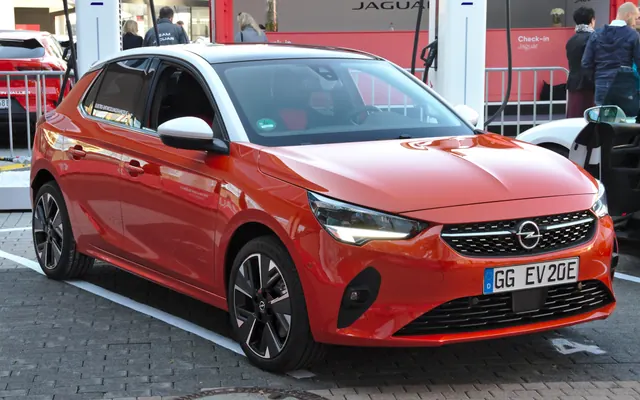
Vauxhall Corsa
1,531,302 tests · 70.8% pass
Petrol
1,398,126
Diesel
133,068
- 05
Vauxhall Astra
1,150,896 tests · 72.5% pass
Petrol
796,233
Diesel
354,436
- 06
Volkswagen Polo
1,133,725 tests · 73.5% pass
Petrol
1,034,509
Diesel
99,161
- 07
Ford Transit
1,121,832 tests · 69.3% pass
Petrol
5,411
Diesel
1,115,717
- 08
Nissan Qashqai
1,004,500 tests · 75.4% pass
Petrol
483,272
Diesel
521,129
- 09
BMW 3 Series
811,923 tests · 78.7% pass
Petrol
283,254
Diesel
520,926
- 10
Audi A3
784,385 tests · 80.1% pass
Petrol
378,805
Diesel
400,759
- 11
Mercedes Benz C
776,502 tests · 80.5% pass
Petrol
265,417
Diesel
477,701
- 12
Volkswagen Transporter
598,195 tests · 74.0% pass
Petrol
23,285
Diesel
574,608


What each fuel fails for.
Top defect codes for cars where the fuel listed is the dominant variant. Same fleet-wide checks on both, so divergence here points to fuel-specific wear.
Petrol — top defects
- 01
A rear registration plate lamp or light source missing or inoperative in the case of multiple lamps or light sources
526,846 - 02
A suspension pin, bush or joint excessively worn
370,356 - 03
Tyre tread depth not in accordance with the requirements
364,326 - 04
A spring or spring component fractured or seriously weakened
290,256 - 05
Headlamp reflector or lens slightly defective
215,650
Diesel — top defects
- 01
Windscreen or window damaged or seriously discoloured but not adversely affecting driver's view
687,711 - 02
A rear registration plate lamp or light source missing or inoperative in the case of multiple lamps or light sources
605,834 - 03
Tyre tread depth not in accordance with the requirements
301,311 - 04
A transmission shaft constant velocity joint boot severely deteriorated
212,795 - 05
A suspension pin, bush or joint excessively worn
204,025
Where next
Compare any two UK cars side-by-side, or browse the full fuel-segment leaderboards.