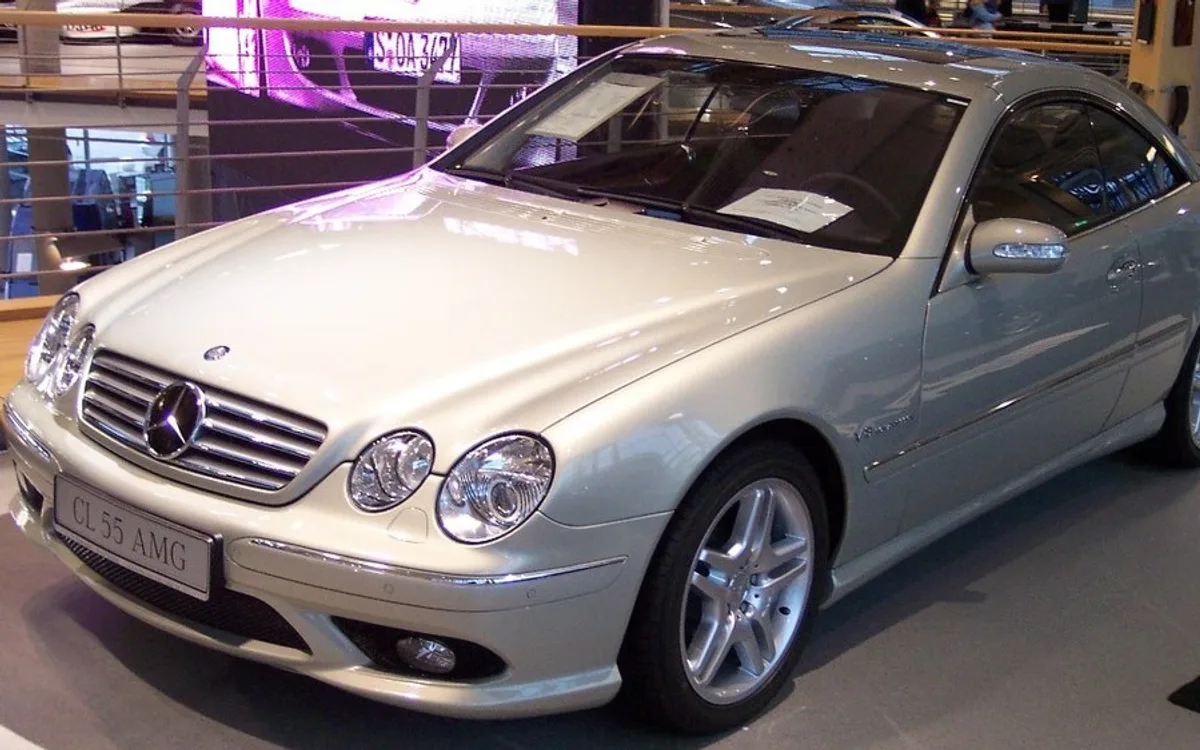
Mercedes Benz
CL
3,276 MOT tests analysed. sits above the UK fleet average — here's where CLs pass, fail, and end up on the retest sheet.
That's 6.7 points above the UK fleet average across our 1,984 tracked models — a confident result.
Pass
84.2%
Pass-after-fix
1.8%
Fail
13.1%
Avg miles
84,028
Pass + Pass-after-fix + Fail = 100%
Trim variants
The picture
Cl: middle-of-the-pack on first-time pass
Across 1,677 MOT tests, the Cl returns 79.5% first-time pass — roughly in line with the UK fleet average. The single most-logged Major fail is a tyre with the cords showing. Windscreen damage and a corroded brake pipe round out the top three. Average tested mileage sits at 85,909, which is the lens to read those failure rankings through. If you own one and the next test is close, the ranked list below is a sensible pre-test checklist.
ABI Insurance Group
Group 28–46
A high-group car — insurance costs will be significantly above average. Lower groups cost less to insure; UK fleet average is around Group 22.
Source: ABI Group Rating Panel · administered by Thatcham Research · groups cover standard variants; performance trims may sit higher. Browse all insurance groups →
28–46
out of 50
Top ten reasons for rejection.
Filter failures:
Hide categories
Tick a category to hide it from rankings sitewide. Saved in this browser only.
- 01
A suspension joint dust cover severely deteriorated
69 occurrences · 2.1% of tests
- 02
Windscreen or window damaged or seriously discoloured but not adversely affecting driver's view
58 occurrences · 1.8% of tests
- 03
A rear registration plate lamp or light source missing or inoperative in the case of multiple lamps or light sources
44 occurrences · 1.3% of tests
- 04
A suspension pin, bush or joint excessively worn
44 occurrences · 1.3% of tests
- 05
Brake pipe damaged or excessively corroded
41 occurrences · 1.3% of tests
- 06
A tyre cords visible or damaged
33 occurrences · 1.0% of tests
- 07
A tyre seriously damaged
29 occurrences · 0.9% of tests
- 08
Warning device shows system malfunction
29 occurrences · 0.9% of tests
- 09
A tyre seriously damaged
27 occurrences · 0.8% of tests
- 10
Tyre tread depth not in accordance with the requirements
25 occurrences · 0.8% of tests
Counts cover Major and Dangerous defects logged at test. Advisory items excluded so this shows why a car was rejected, not just what the tester flagged in passing.
Worst-case fix budget · top 4 failures
£208–£605
If every one of this CL's most-logged Major fails hit at the same MOT, that's the real-world UK garage range. Reality is usually one or two items, not all of them. Open the estimator →
Try the calculator
Build your own retest budget.
Tools that pre-empt a retest.
Picked against this car's top failure patterns. Affiliate links to Amazon UK — we earn a small cut at no cost to you. Disclosed up-front, doesn't shape the data.
My Motor World · affiliate
Parts & supplies for this fix
Affiliate links — small commission, no extra cost to you.


Click Mechanic · affiliate
Book a mobile mechanic
Affiliate links — small commission, no extra cost to you.
Mobile mechanic · UK-wide
Book a mechanic at your door.
Fixed-price quotes upfront. No garage needed. Click Mechanic sends a vetted local mechanic to you — home, work, or roadside.
Buying or keeping a CL?
Use the failure ranking as a pre-test checklist or a haggling lever. Treat the headline pass rate as a fleet-wide trend, not a guarantee on any individual car.
If you own a CL and your last MOT looked nothing like the ranked failures above, that's normal — individual cars vary widely. The ranking shows the patterns testers flag most often across the country.